
A Server Error has Occurred: How to use the Chrome Developer Tools
This guide addresses server errors, which often manifest as red-boxed messages on the screen. A common symptom of a server error is the "500 Internal Server Error" message.
In This Article
- Before Getting Started
- How to Use Chrome Developer Tools
- How to Submit Your Findings to Support
Before Getting Started
- This guide addresses server errors, which often manifest as red-boxed messages on the screen. A common symptom of a server error is the "500 Internal Server Error" message.
- Additionally, this article is useful when reports fail to load or return a "Failed" status.

How to Use Chrome Developer Tools
- Open Developer Tools: Right-click on any button in the Spirion Web Console and select Inspect. This will open the Chrome Developer Tools.
- Select the Network Tab: Click on the Network tab at the top of the Developer Tools.
- Enable Recording: Ensure that the red record button is selected or hovered over to capture all network activity.
- Refresh the Page: Reload the page where the error is occurring.
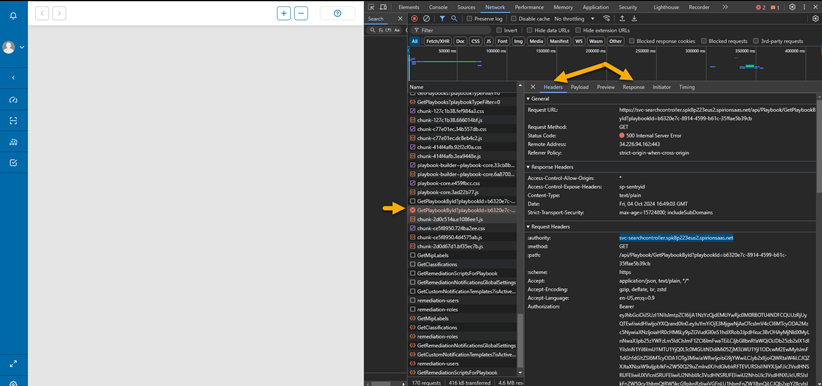
- Review Network Calls: In the left panel of the Developer Tools, you'll see a list of all network calls.
- Identify Error Calls: Look for any calls marked in red text or those displaying the number "500."
- Capture Screenshots: Take screenshots of both the headers, payload, and response for your support submission.
How to Submit Your Findings to Support
- Access Support: Navigate to Spirion Customer Home.
- Choose Support Option: Select either SDP Support or Support Ticket.
- Complete the Support Ticket: Fill out the required fields, including:
- A description of what happened
- The actions you were performing when the error occurred
- The screenshots you collected from the Developer Tools
- Await Response: A support representative will reach out to you shortly.