
How to Use Scan Settings
Overview
Scans Settings is where you manage your settings for:
- Scan Item Number and Load
- Target Preferences
- Remediation Settings
- Policy and Application Updates
- Notifications and Custom Notifications
- Data Retention
Note: Changes to Scans Settings take effect the moment data is entered into any field.
If you wish to retain a copy of the original settings when making updates if you need to revert back to the previous settings.
How to Access Scan Settings
To access the Scan Settings screen, use the following steps:
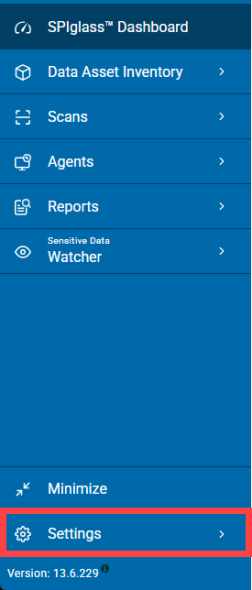
- From the left menu, click Settings.
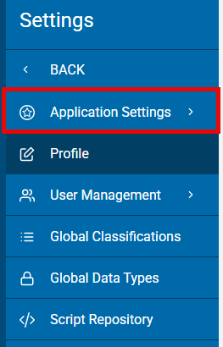
- Click Application Settings.
- To view sections in Scans Settings:
- Click a down arrow to expand a section.
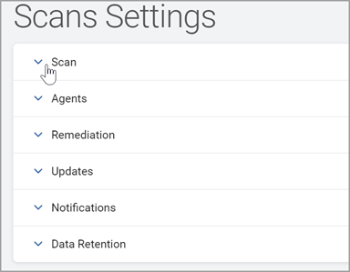
- Click an up arrow to collapse a section.
- Click a down arrow to expand a section.
How to Configure Scan Settings
To configure Scan Settings use the following steps:
- From the left-side navigation menu click Settings > Application Settings > Scans Settings.
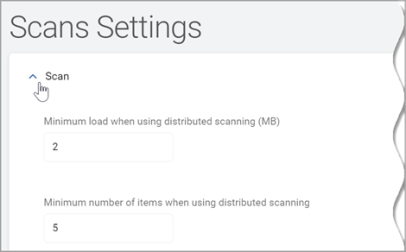
- Click the down arrow to expand the Scan section.
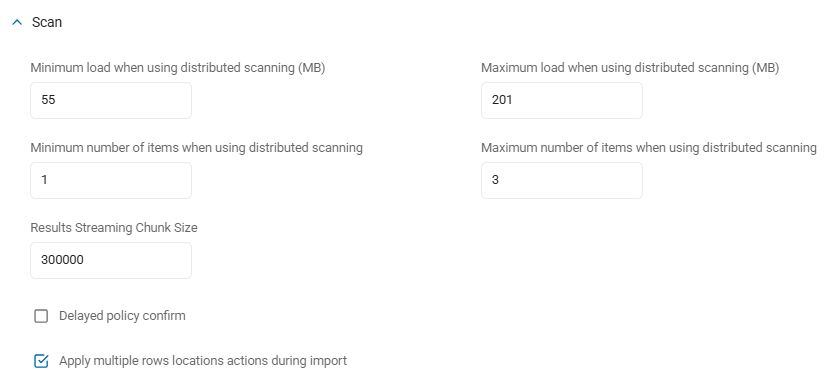
- Fill in the settings below - note that only some of these settings apply to Greyhound Agents (v13.0 and later).
Scans Settings
The sub-topics below describe the various scan settings. Before continuing note which settings apply to Greyhound Agents (version 13 and later) and which do not.
Use the table here as a reference.
Summary of which settings apply to Greyhound Agents (v13.0+)
Setting | Applies to Greyhound (v13.x)? | Reason |
|---|---|---|
Minimum load when using distributed scanning (MB) | No | These are for the |
Maximum load when using distributed scanning (MB) | No | These are for the |
Minimum number of items when using distributed scanning | No | Same as above; Greyhound Agents process an assigned policy as a single unit of work. |
Maximum number of items when using distributed scanning | No | Same as above; Greyhound Agents process an assigned policy as a single unit of work. |
Results Streaming Chunk Size | Yes | Greyhound Agents also "batch" their findings before shipping them to the Ingress server to save bandwidth. |
Delayed Policy Confirm | Yes | To prevent "thundering herd" issues, Greyhound Agents can delay their acknowledgment of a new policy. |
Apply multiple rows locations actions during import | Yes | This is a Console-side setting. It affects how the server processes data, regardless of whether it came from a Windows, Mac, or Linux Agent. |
Guidance for Mac/Linux Agents
If you are looking to "distribute" a scan across multiple Mac or Linux machines, the current best practice is to segment the Targets via Policies.
- Example: Create one policy for "Linux Group A" to scan
/var/logand another policy for "Linux Group B" to scan/home.
Because Greyhound Agents are designed for high-performance local scanning, they are optimized to handle their own file systems independently rather than acting as a distributed "worker bee" for a remote network share.
Minimum Load When Using Distributed Scanning (MB)
- This setting is a load-balancing threshold used to determine when a distributed scan should "split" a large task across multiple Agents.
- This setting defines the minimum size of a single data object (such as a very large database table or a massive file) that must be present before the console divides that work among different Agents in a distributed scan group (called a "Discovery Team").
- This setting is used only when load balancing is enabled.
- These limits apply only to Sensitive Data Manager (SDM) Agents (versions 12.6.1 and earlier), NOT Greyhound Agents (versions 13.0+)
- Valid values: 0-999,998
- Value of 0 disables this setting
- Default Value: Usually set to 100 MB
- What it does
- Below the Threshold: If a table is only 50 MB and your setting is 100 MB, a single agent will pick up the task and scan the whole table.
- Above the Threshold: If a table is 500 MB and your setting is 100 MB, the console's distributed scanning logic (via the job_queue) will attempt to break that table into "chunks" so that multiple agents can scan it simultaneously.
- Why it exists
- Efficiency vs. Overhead: Distributing a task requires "management overhead" (creating multiple jobs in the database, tracking multiple workers, and merging results). If the task is small, it is faster for one agent to just do the work than it is for the system to coordinate five Agents.
- Preventing "Fragmentation": Without a minimum threshold, the system might try to distribute thousands of tiny 1 KB files, which would overwhelm the job_queue with trivial tasks and actually slow down the overall scan.
- Optimization for Large Targets: This setting ensures that distributed power is reserved for the "heavy lifters"—the multi-gigabyte databases or file shares where parallel processing actually provides a time-saving benefit.
- How it works in the workflow (Windows Agent Architecture)
- Discovery Phase: One Agent (the "Master" or "Discovery" agent) quickly crawls the target to see how much data is there.
- The Comparison: The console looks at the size of the objects found (for example, Table A is 300 MB).
- Queueing: If 300 MB > Minimum Load (e.g., 100 MB), the console creates multiple "Work Items" in the job_queue table of the PostgreSQL database.
- Execution: Different Windows Agents checking the queue see these work items and begin scanning their respective "chunks" in parallel.
- Recommendations
- When to Lower It: If you have a very powerful network and many idle Agents, and you want to ensure even medium-sized tables are scanned as fast as possible, you can lower this to 50 MB.
- When to Raise It: If you notice your job_queue is becoming massive or your database performance is dipping during scans, raising this to 500 MB or 1000 MB (1 GB) can help by reducing the number of total tasks the system has to manage.
- Architectural Note: Remember that this specifically applies to Distributed Scans. Local scans (where one agent scans its own drive) do not use this logic. This is primarily for scanning large remote SQL databases or large Network File Shares.
- Summary
- The “Minimum Load When Using Distributed Scanning (MB)” setting is a parallelization trigger. It ensures that the complexity of distributed scanning is utilized only for tasks large enough to justify the coordination effort, keeping the platform efficient and scalable.
Minimum Number of Items When Using Distributed Scanning
- This setting is a workload-balancing threshold that determines the minimum quantity of data objects (files or database tables) required before the console will trigger distributed processing.
- Applicability: This setting applies only to Windows SDM Agents (versions 12.6.1 and earlier) NOT Greyhound Agents (versions 13.0+). It is a console-side orchestration setting that governs how work is divided before it is sent to the Agents.
- Valid values: 0-999,999
- Default Value: Typically set to 100 or 500 items in v13.6.
- What it does
- This setting acts as a "floor" for the number of items in a scan. If the total number of items found during the discovery phase is less than this number, the console does not split the work across multiple Agents. Instead, the entire task is assigned to a single Agent.
- Below the Threshold: If you are scanning a folder with 50 files and your setting is 100, one Agent will perform the entire scan.
- Above the Threshold: If you are scanning a folder with 500 files and your setting is 100, the console will begin the process of "chunking" those files into multiple work items for the Discovery Team to process in parallel.
- Why it exists
- Efficiency and Overhead: Creating, managing, and tracking distributed "work items" in the Postgres job_queue requires system resources (CPU and Database IO). For a small number of files, the administrative overhead of coordinating multiple Agents is actually slower than just letting one Agent finish the job.
- Reducing "Database Chatter": In large environments, if every tiny 10-file scan was distributed, the
svc-agentcontrollerand the Postgres database would be overwhelmed with thousands of trivial queue entries. This setting keeps the database "clean" by only distributing "substantial" scans. - Predictable Scheduling: It ensures that small, quick scans finish predictably without waiting for the distributed coordination logic to initialize.
- How it works in the workflow
- Discovery Phase: The "Discovery Agent" crawls the Target (for example, a small SQL database) and counts the number of tables.
- The Count Check: The console looks at the count (for example, 40 tables) and compares it to the Minimum Number of Items (for example, 100).
- Execution Path: Since 40 < 100, the console skips the "distributed chunking" logic and simply issues one single command to one worker Agent to scan all 40 tables.
- Recommendations:
- The "Sweet Spot": For most enterprise environments, a value of 100 to 500 is ideal.
- When to Lower It: If you have very few Agents but those Agents are extremely slow (old hardware), and you want to ensure even small folders are split up, you can lower this to 10.
- When to Raise It: If you have a massive Agent fleet and notice that your Postgres database is struggling with too many small tasks in the
job_queue, raise this to 1,000. This forces smaller scans to be handled by single Agents, reducing the total load on the console.
- Summary
- The “Minimum Number of Items When Using Distributed Scanning” is a distribution trigger.
- It ensures that the power of distributed scanning is only invoked when there are enough individual items to justify the management effort, keeping your Spirion Sensitive Data Platform environment lean and efficient.
Maximum Load When Using Distributed Scanning (MB)
- The setting “Maximum Load When Using Distributed Scanning (MB)” is a load-balancing constraint that defines the maximum amount of data for each Agent performing a distributed scan.
- Discovery Teams, when scanning a Target during a distributed scan, limit each team member to a maximum amount of data, (in megabytes) to scan.
- The amount of data from all Targets is calculated and split into data sets, with no data set exceeding the value of the maximum load - unless a single folder exceeds the value of the maximum load in which case that folder is not divided and is searched by a single team member.
- These limits apply only to Sensitive Data Manager (SDM) Agents (versions 12.6.1 and earlier), NOT Greyhound Agents (versions 13.0+)
- Valid values: 1-999,999 (megabytes)
- Default Value: In newer versions of Spirion Sensitive Data Platform, the default is typically 2048 MB (2 GB), though historically it can be set much higher (50 GB+).
- What it does
- This setting establishes the maximum size that a single task can be before the console stops trying to make it larger. When a distributed scan is "planning" how to divide a large target (like a multi-terabyte file share or a massive SQL database), it uses this value as a ceiling for the pieces of work it hands out to agents.
- Task Capping: If you have a 10 GB database table and this setting is 2 GB (2048 MB), the console will attempt to break that table into at least five 2 GB chunks so they can be processed by different agents.
- Preventing "Monolithic" Tasks: It ensures that one single "Search" agent doesn't get "stuck" processing a massive 50 GB file for ten hours while other agents in the cluster sit idle because their smaller tasks finished in minutes.
- Why it exists
- Parallelization Efficiency: By capping the size of work items, you ensure that the workload is spread more evenly across all available agents in your distributed group.
- Resource Safety: It prevents an agent from being overwhelmed by a single, massive data object that might cause memory exhaustion or time out the connection to the console.
- Error Recovery: If a 50 GB scan task fails at 90%, the agent usually has to restart that entire task. If that work was broken into twenty-five 2 GB tasks, a failure only forces the restart of one small 2 GB chunk.
- How it works in the workflow
- Discovery Phase: The "Discovery Agent" enumerates the target and sees a 10 GB file.
- Logic Check: The console compares the file size to the Maximum Load (e.g., 2048 MB).
- Job Creation: Because 10 GB > 2 GB, the console generates multiple entries in the job_queue (Postgres table) for that single file/table.
- Worker Pickup: Multiple "Search Agents" check the queue and each grab one of those 2 GB segments to scan simultaneously.
- Recommendations
- The "Sweet Spot": For most enterprise environments, 2048 MB (2 GB) is the recommended balance between performance and management overhead.
- When to Lower It: If your Agents are running on low-resource hardware (limited RAM) or your network is unstable, lowering this to 1024 MB (1 GB) can make the scan more resilient.
- When to Raise It: If you have very few Agents but extremely high-speed local storage, raising this can reduce the amount of "chatter" between the Agents and the console database, slightly improving discovery speed.
- Summary
- The “Maximum Load When Using Distributed Scanning (MB)” setting is a granularity control. It ensures that large data targets are broken down into manageable "bite-sized" pieces, allowing your distributed agent fleet to work in parallel and finish the scan as quickly as possible.
Maximum Number of Items When Using Distributed Scanning
- This setting is a workload-capping configuration that limits how many individual "work units" (files or database tables) are grouped together into a single task for a worker Agent.
- When using the maximum number of items while using distributed searching, this is the maximum number of items that can be assigned.
- These limits apply only to Sensitive Data Manager (SDM) Agents (versions 12.6.1 and earlier), NOT Greyhound Agents (versions 13.0+)
- Valid values: 0-999,999,999
- Default Value: Typically set to 5,000 or 10,000 items.
- What it does
- This setting defines the maximum count of individual items (files, emails, or database rows) that can be contained within a single "search part" during a distributed scan. It acts as the "ceiling" for the volume of objects assigned to an agent in a single task.
- While the "Maximum Load (MB)" setting caps the size of the data, this setting caps the quantity of items. It is essential for maintaining balance in environments with a high volume of small files.
- Why it exists
- Workload Capping: If the Analysis Phase identifies 100,000 files in a target and this setting is set to 10,000, the platform will break the scan into at least 10 separate search parts.
- Load Balancing: If one agent grabs a task with 1,000,000 files and another Agent grabs a task with 10 files, the second Agent will finish instantly and sit idle while the first Agent works for hours. Capping the item count ensures the work is spread more evenly across the available Agent fleet.
- Database Performance: Extremely large work items require large XML blobs to be stored in the PostgreSQL database's
job_queuetable. Keeping the item count reasonable prevents database bloat and ensures thesvc-agentcontrollercan quickly serve tasks to Agents.
- How it works in the workflow
- Discovery: The "Discovery Agent" crawls a file share and finds 50,000 small text files.
- Threshold Check: The console sees the Maximum Number of Items is set to 5,000.
- Queueing: The console generates 10 separate entries in the
job_queuetable. - Distribution: Ten different Windows agents (if available) can each pick up one of those 5,000-file batches and scan them in parallel.
- Recommendations
- Default/Testing Value: In testing scenarios, this is often set to a low number (for example, 10 or 100) to force the platform to distribute work across multiple Agents even when the file count is low.
- When to Lower It: If you are scanning over a high-latency WAN or unstable VPN, lower this to 1,000. This makes the "checkpoints" more frequent, so if a connection drops, less work is lost.
- When to Raise It: If you are scanning a massive "Archive" share with millions of tiny files over a very fast 10Gbps backbone, you can raise this to 20,000 to reduce the overhead of Agents constantly checking in for new work.
- Interaction with MB Settings: This setting works alongside the "Maximum Load (MB)" setting. The console will stop adding items to a task whenever it hits either the maximum MB limit or the maximum item count—whichever comes first.
- Why it matters for troubleshooting:
- Agent Idle Time: If you have many agents but only one or two are active, your "Maximum number of items" might be set too high. The console may have bundled the entire scan into just one or two parts because the total file count didn't exceed your limit.
- Scan "Hanging": If a scan appears to be "stuck" on one agent for a long time, it may be processing a single, massive search part. Lowering this value in the settings will force the console to break that work up and share it with other agents in future scans.
- Summary
- The “Maximum Number of Items When Using Distributed Scanning” setting is a batch-size regulator.
- It ensures that distributed work is broken into manageable "chunks" of files, promoting better parallel processing, easier error recovery, and more stable database performance.
Results Streaming Chunk Size
- This setting is a performance configuration that controls the volume of match data an Agent sends back to the console in a single network transmission.
- This setting applies only to Greyhound Agents (versions 13.0+)
- Default: 500000 (bytes). Typically set to 100 or 200 results per chunk in version 13.6.
- What it does
- This setting determines the maximum number of individual search results (matches) the Spirion Agent's "Shipper" process bundles together before "shipping" them to the Ingress server.
- Small Chunk Size (for example, 50): The Agent sends results very frequently in small bursts.
- Large Chunk Size (for example, 500 or 1000): The Agent waits until it has collected a large batch of matches before opening a connection to send them all at once.
- Why it exists
- Network Efficiency: Every time an Agent sends data to the console, there is "overhead" (establishing an HTTPS connection, authentication, headers). Sending 1,000 matches in one big "chunk" is much more efficient for the network than sending 1,000 separate messages.
- Ingress Throughput: The Ingress service on the SDP console has to receive, decrypt, and prepare these results for the database. Processing a few large files is generally faster for the server than processing thousands of tiny "micro-results."
- Memory Management: If an Agent finds 1,000,000 matches (for example, a "hit" on every line of a massive log file), it cannot hold all of them in RAM at once. The Chunk Size acts as a "pressure valve"—once the Agent hits that limit, it flushes the memory by shipping the chunk.
- How it works in the workflow
- Scanning: The Agent Worker finds sensitive data and writes it to the local shipper_queue (a SQLite database on the endpoint).
- Threshold Check: The Shipper process monitors the queue. It counts how many "unshipped" results are waiting.
- Shipping: Once the count reaches the Results Streaming Chunk Size, the Shipper packages them into an encrypted XML or JSON blob and POSTs it to the console's Ingress URL.
- Confirmation: Once the console acknowledges receipt, the Agent marks those results as "Sent" in its local database.
- Recommendations
- When to Raise It: If you are performing a "Baseline Scan" where you expect millions of matches (high-noise environment), raising this to 500 or 1000 can significantly reduce the "chatter" and help the scan finish faster.
- When to Lower It: If your agents are on very unstable or slow satellite/VPN connections, lower this to 50. This ensures that if the connection drops, only a small amount of data needs to be "re-shipped."
- The "Postgres Impact": Be careful—setting this too high (e.g., 5,000+) can result in very large XML payloads that might time out the Ingress server or cause a temporary "spike" in Postgres CPU usage during ingestion.
- Summary
- The “Results Streaming Chunk Size” is a batch-processing toggle.
- It balances the frequency of agent communication against the efficiency of data transfer, ensuring that match results flow from the endpoints to the console without overwhelming the network or the server.
Delayed policy confirm
- The setting “Delayed Policy Confirm” is a performance optimization feature designed to reduce database "lock contention" and network chatter when a large number of Agents receive a new policy simultaneously.
- Default Value: Disabled (unchecked)
- What it does
- Normally, when an Agent receives a new or updated policy from the console, it immediately sends back an acknowledgment (a "confirmation") to let the console know the policy was successfully applied.
- When Delayed Policy Confirm is enabled, the Agent waits for a randomized period of time (or until its next scheduled heartbeat) before sending that confirmation back to the console.
- Disabled (Immediate): 5,000 agents get a policy at 9:00 AM; 5,000 agents try to write a "Success" message to the Postgres database at 9:00:01 AM.
- Enabled (Delayed): 5,000 agents get a policy at 9:00 AM; they trickle their confirmations back over the next several minutes or during their next natural check-in.
- Why it exists
- Preventing "The Thundering Herd": In large enterprise environments (10,000+ agents), sending a single policy update can cause a massive spike in traffic. If every agent hits the API at the exact same second to say "I got it," it can overwhelm the Agent Controller and cause database timeouts in Postgres.
- Database Health: Writing a "Policy Received" status requires an
UPDATEorINSERTcommand in the console database. High-concurrency writes to the same tables can cause "Row Locking," which slows down the entire console UI for other users. - Prioritizing Search Traffic: By delaying the "administrative" confirmation of a policy, the system ensures that more critical traffic—like Search Results or Heartbeats—has more room to flow through the Ingress pipe.
- How it works in the workflow
- Policy Push: An administrator clicks "Save and Deploy" on a policy.
- Distribution: The console flags the agents to pick up the new configuration during their next communication.
- Receipt: The Windows or Mac/Linux agent downloads the new policy and applies it to its local configuration.
- The Delay: Instead of instantly calling the
ConfirmPolicyAPI, the agent continues its work (or remains idle). - Confirmation: The agent sends the confirmation packet later—often bundled with its next Heartbeat. The console then updates the "Policy Status" column in the Agent list to "Up to Date."
- Recommendations
- Best Practice: Enable this setting in production environments. There is very little downside to waiting a few minutes to see a "Green Checkmark" in the console, but there is a significant upside to server stability.
- Troubleshooting Tip: If you deploy a policy and the "Policy Status" in the Agent grid stays "Pending" for a few minutes even though you know the agents are online, do not panic. This is likely the "Delayed Policy Confirm" setting doing its job. Wait one full heartbeat cycle (typically 15-60 minutes) before assuming the policy failed to deploy.
- When to Disable: Only disable this in small Lab/Test environments where you want instant feedback for debugging policy logic.
- Summary
- The “Delayed Policy Confirm” setting is a traffic-smoothing mechanism.
- It prevents the console from being overwhelmed by administrative "I'm ready" messages, ensuring the platform remains responsive during large-scale policy deployments.
Apply multiple rows locations actions during import
- This setting is a backend processing toggle that controls how the console handles Workflow Actions (like Status changes or Classifications) when a single file or database record is reported multiple times in a single result set
- Default Value: This is typically Enabled by default in v13.6 to ensure the highest level of policy enforcement.
- What it does
- When an Agent performs a scan, it often finds multiple "matches" (rows of sensitive data) within a single "location" (a specific file or database table).
- If you have Automatic Actions configured—such as "If an SSN is found, set status to 'To Be Reviewed'"—this setting determines how those actions are triggered during the ingestion process.
- When Enabled (Checked): The console evaluates and applies the appropriate action for every match row it imports for that location. If one file has 10 matches, the console processes the action logic 10 times.
- When Disabled (Unchecked): The console may only apply the action for the first match it processes for that location, then skip the action logic for subsequent matches in that same file during that specific import session.
- Why it exists
- Policy Consistency: In complex environments, a single file might trigger multiple different policies (for example, a "PCI Policy" and a "HIPAA Policy"). Each policy might have a different required action. This setting ensures that both sets of actions are applied immediately upon import.
- Accuracy of "Automatic Status": If you use rules to automatically mark data as "Restricted" or "Public," you want the console to be 100% sure it has evaluated every match in a file before finalizing that status.
- Audit and Remediation: Many compliance workflows require an audit trail for every single instance of sensitive data. Applying actions to "multiple rows" ensures that the history of the location accurately reflects that all sensitive items were processed.
- How it works in the workflow
- Scanning: A Windows Agent scans
Finance_Report.xlsxand finds 5 Credit Cards and 5 SSNs. - Shipping: The Agent sends a "Result Chunk" to the Ingress server containing all 10 matches.
- Ingestion: The Ingress service begins writing these matches to the Postgres database.
- Action Execution:
- If Enabled: The console looks at Match #1 (Credit Card) and applies the "PCI Action." It then looks at Match #6 (SSN) and applies the "PII Action" to the same file.
- If Disabled: The console applies the "PCI Action" for Match #1 and might consider the file "processed" for actions, potentially missing the "PII Action" until a later manual refresh or task.
- Scanning: A Windows Agent scans
- Recommendations
- Best Practice: Always keep this Enabled. It is critical for maintaining an accurate "State of the World" on your Dashboard. If it is disabled, your files might show an incorrect status if they contain multiple types of sensitive data.
- Troubleshooting: If you find that "Automatic Actions" are only working intermittently, or some files aren't getting the tags they should, verify that this setting is checked.
- Summary
- The “Apply multiple rows locations actions during import” setting is a workflow enforcement tool. It ensures that no matter how many "hits" a single file generates, the console applies every required administrative and compliance action for that file during the ingestion process.