
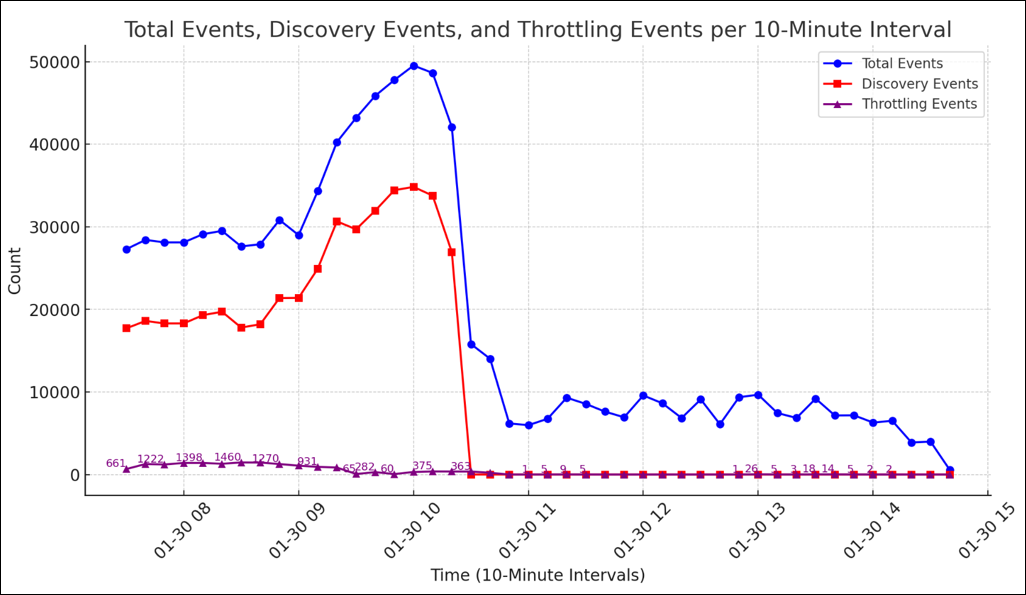
Guide to Analyzing Logs and Generating Graphs in Time Intervals
This steps in this topic enable you to visualize event trends such as the trend of Discovery and Throttling events.
Guide to Analyzing Rate of System Search Logs
Follow the steps in this topic to visualize event trends efficiently. For example:
Step 1: Extract Relevant Log Entries
Procedure:
- Open EmEditor and load all the log files. (Or other text editors that will allow you to filter down to the timestamps of specific logged events)
- Use the ‘Filter’ feature to search for and filter down to specific events, such as:
- "Discovery part - successfully write job to job queue" (events indicating successfully publishing to the job_queue a locations details that requires search)
- "Search part - read the job" (events indicating successfully consuming from the job_queue which prefaces the API call to download the next location)
- "throttledRequest" (events signifying API responses that we have reached the targets speed limitation)
- Bookmark the matching rows of these events you are interested in evaluating in each log file.
- While all files remain open in EmEditor, use the 'Combine Files' feature:
- Select 'Bookmarked Lines Only' to merge only the relevant lines into one file.
Step 2: Prepare the Combined File
Procedure:
- Use CTRL+H to remove brackets - '[' and ']' - around timestamps (in case some logs include them, while others do not).
- Sort the entire file in ascending order (A-Z) to arrange all events chronologically.
Step 3: Generate the Data Files for Graphing
How to Create the 'Total Events' File
Procedure:
- Use FILTER OUT to hide the 'throttledRequest' events.
- Copy the remaining lines to a new file so that it only includes the events for publishing and consuming from the job queue.
- Remove all content except the timestamps.
- Save the file as 'Total_Events.txt'.
How to Create the 'Total Discovery Events' File
Procedure:
- Filter down to only 'Discovery part - successfully write job to job queue' events.
- Copy the remaining lines to a new file.
- Remove all content except the timestamps.
- Save the file as 'Total_Discovery_Events.txt'.
How to Create the 'Throttling Events' File
Procedure:
- Filter down to only 'throttledRequest' events.
- Copy the remaining lines to a new file.
- Remove all content except the timestamps.
- Save the file as 'Throttling_Events.txt'.
Step 4: Use ChatGPT to Generate Graphs
Procedure:
- Upload the prepared timestamp files ('Total_Events.txt', 'Total_Discovery_Events.txt', 'Throttling_Events.txt').
- If the files are too large to upload, you can zip them up and upload the zip file(s).
- Request ChatGPT via (REMOVED PER CISO GUIDANCE 02/20/26) to process the data into 10-minute intervals (or 1 minute intervals, 1 hour intervals, etc.) and the GPT should generate:
- A graph for Total Events.
- A graph for Total Discovery Events.
- A graph for Throttling Events.
- A combined graph displaying all three event types on one timeline, with labels on throttling events where applicable.
- After interacting with the GPT, requesting things such as label values as necessary, etc., the outcome should resemble the example at the top of this page.