
Working with Agents - Overview
To learn what an Agent is and what it does, see What is an Agent?
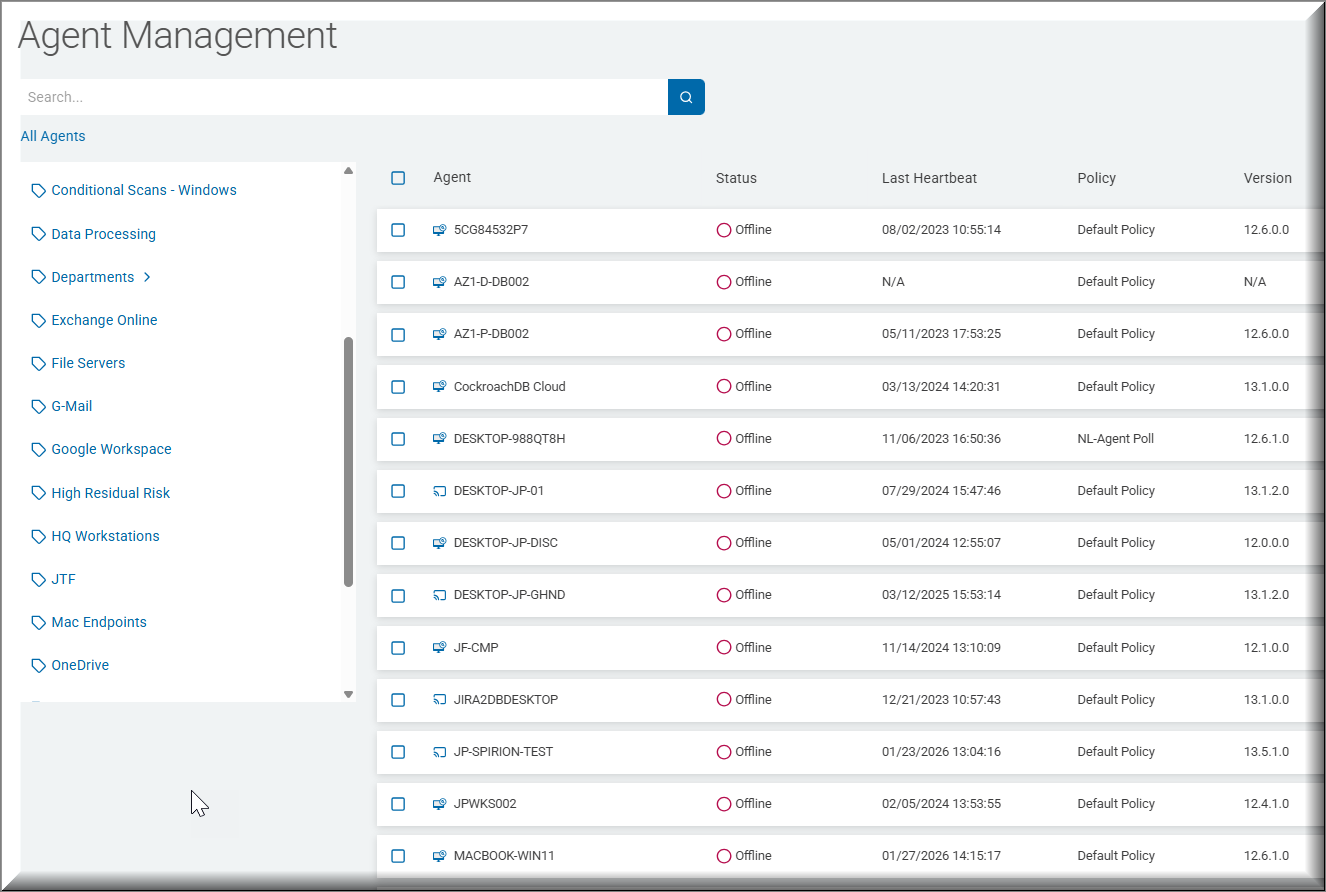
You manage your various Agents on the "Agent Management" page in Spirion Sensitive Data Platform. Your environment may come to employ dozens of Spirion Agents each scanning your environment for sensitive data (PII or SPI).
Some Agents may be responsible for scanning Mac laptops, while others are responsible for scanning SQL databases, File Servers, G-mail accounts, or OneDrive accounts.
Agent Management Page
The Agent Management page is the "Fleet Command" center for your Spirion worker environment. It provides a real-time view of the health, connectivity, and configuration of every Agent registered to your console.
The Role of the Agent Management Page
This page is where you supervise your "field operators." Its primary roles include:
- Health Monitoring: Ensuring that agents are online and communicating with the console.
- Lifecycle Management: Tracking which agents are active, which are new (pending registration), and which have gone offline.
- Configuration & Tagging: Organizing your agents into logical groups (e.g., by region or capability) so they can be assigned to scans efficiently.
- Troubleshooting: Identifying connectivity or service issues before they impact your scheduled scans.
What the Information in the Table Does for You
The table on this page is your primary diagnostic tool.
The table below describes how to interpret the key columns:
Column / Information | What it Does for You |
|---|---|
Agent Name / Hostname | Identification: Tells you exactly which machine the Agent is installed on. This is critical when you need to log in to a specific server to collect logs or perform maintenance. |
Status (Online/Offline) | Triage: The most important column. If an Agent is "Offline," it cannot receive new scan instructions or ship results. A "Red" status here is your immediate signal to investigate the host machine. |
Last Heartbeat / Last Seen | Connectivity Check: Shows the last time the Endpoint Service (EPS) successfully checked in with the console. If this timestamp is more than a few minutes old, it may indicate a network or proxy issue. |
Agent Version | Maintenance: Helps you identify Agents that need an update. Running mismatched versions across your fleet can lead to inconsistent scan results or performance issues. |
Agent Tags | Orchestration: Shows the logical groups the Agent belongs to (for example, |
Operating System | Compatibility: Confirms the host environment (Windows, macOS, Linux). This is useful for ensuring you are assigning the right tasks to the right platforms (for example, not assigning a Windows-specific task to a Linux Agent). |
Recommendations: The "Pre-Flight" Health Check
Before you start a large discovery project, use the Agent Management page to perform a "Pre-Flight" check:
- Filter by Tag: View only the Agents assigned to your upcoming project.
- Check Heartbeats: Ensure all Agents have checked in within the last 5 minutes.
- Verify Versions: Confirm that all Agents in the group are running the same version to ensure consistent detection logic.
Summary
The Agent Management page is your "Fleet Health Dashboard."
By monitoring the table's status and heartbeat columns, you can ensure that your worker fleet is ready to execute the discovery and remediation tasks defined in your playbooks. If the Data Assets and Targets page is your "Mission Map," this page is your "Crew Roster."
Additional Tools for Agents
It's important to remember:
- You can create Tags to group your various Agents.
- Tags are a collection of Targets (data sources such as box, OneDrive, SharePoint, etc.) or Agents.
- Policies control the behavior of Agents.