How to Use Audit Logs
Overview
In the Spirion Sensitive Data Platform (SDP), the Audit Log page is the central repository for tracking all administrative and operational actions performed within the console. It serves as the "system of record" for accountability and governance.
The Audit Log page is found under Reports > Audit Log.
What is Audit Log Page?
The Audit Log page is the "Memory" of the Spirion platform. It transforms administrative actions into a transparent, auditable narrative, ensuring that your data discovery and protection program remains secure, compliant, and accountable.
The Audit Log page provides a chronological, immutable record of who did what, and when within the Spirion environment. It is designed to ensure that every change to the system's configuration or security posture is documented and attributable to a specific user or automated process.
What Does the Audit Log Page Contain?
The Audit Log page captures a wide range of events, typically including the following:
- User Activity: Logins, logouts, and failed authentication attempts.
- Configuration Changes: Creation, modification, or deletion of Policies, Data Types, SDDs, and Playbooks.
- Scan Management: When scans are created, scheduled, manually started, or stopped.
- Target Management: Adding or removing scan targets (e.g., file shares, databases, cloud repositories) and changes to target credentials.
- Remediation Actions: A record of manual remediation steps taken by console operators (e.g., "User X manually shredded File Y").
- System Settings: Changes to global console settings, logging levels, and integration configurations (like SIEM or SMTP settings).
- Access Control: Changes to user roles, permissions, and group memberships.
What are Audit Logs Used For?
The Audit Log is a critical tool for several key organizational functions:
- Compliance and Auditing:
- It provides the necessary evidence for regulatory frameworks like GDPR, PCI DSS, HIPAA, and CMMC. Auditors use these logs to verify that only authorized personnel are managing sensitive data policies and that remediation actions are being tracked.
- Accountability and Governance:
- If a policy is accidentally deleted or a scan is misconfigured, the Audit Log allows administrators to identify the individual responsible and understand the timing of the change.
- Security Monitoring:
- Security teams monitor the Audit Log for suspicious activity, such as multiple failed login attempts or unauthorized changes to high-impact playbooks (e.g., a playbook that automatically deletes files).
- Troubleshooting:
- When the system behaves unexpectedly, the Audit Log can help determine if a recent configuration change (like a modified regex pattern or a new target credential) is the root cause.
- Incident Response:
- In the event of a data breach or "spillage," the Audit Log helps investigators reconstruct the timeline of events and determine if any security controls were bypassed or altered.
Audit Log Table
The table on the Audit Log page displays activities taken in the system such as policy changes, playbook changes, etc., and enables you to view and filter this information.
- Audit logs enable traceability across the platform for your environment
- Review audit log events to see exactly which changes were made in Spirion, by whom, and at what time

What are Audit Events?
- An Audit “Event” is one discrete action the platform records, such as a user log-in, changing a role, editing a policy, or running a scan
- Audit Log events queue in PostgreSQL for Agents v13.6+ (Agents v13-13.5 use RabbitMQ) and then move to the database
- The event then continues to Audit Log table
- The Audit Log does not retain non-functional event types
- The event state must be successful to be recorded
- Any event that fails is removed from the Audit Log
- When the Type filter uses only event types triggered in Spirion Sensitive Data Platform, they are displayed on the Audit Log screen
- See the How to Use Filters to Find an Audit Log section
Spirion Recommendations
- Regular Reviews: Don't wait for an audit. Periodically review the Audit Log to ensure that administrative actions align with your organization's change management policies.
- Forward to SIEM: For maximum security, use the Spirion Web API to forward Audit Log events to a centralized SIEM (like Splunk). This ensures that the logs are preserved even if the console itself is compromised and allows for correlation with other enterprise security events.
- Restrict Access: Access to the Audit Log page should be restricted to a very small number of high-level administrators to prevent "self-auditing" or unauthorized clearing of the logs.
How to Grant User Access to the Audit Log
- Access to the Audit Log page is limited to users of specific roles.
- To access Audit Logs, an Administrator must apply the Manage privilege in the Manage Administrative Settings area for the user. From the left side navigation menu, navigate to Settings > User Management.
- The Audit Log page is available only to users who are members of a role which contain the Manage privilege.
How to View Audit Logs
Use the following steps to view Audit Logs:
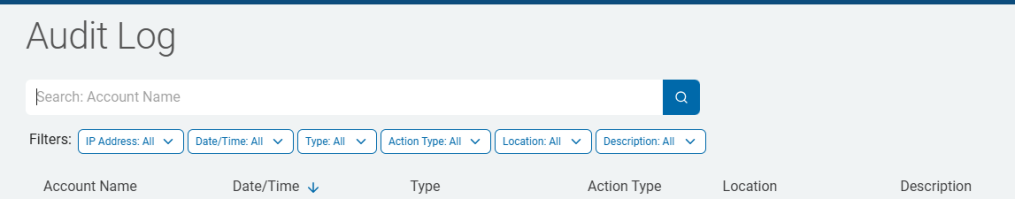
- From the left side navigation menu, click Reports.
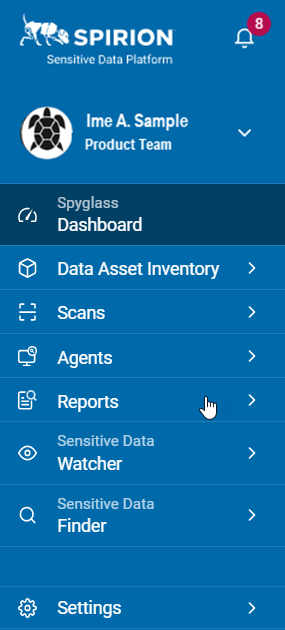
- Next, click Audit Log.
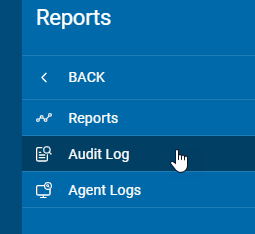
- The Audit Log page appears.
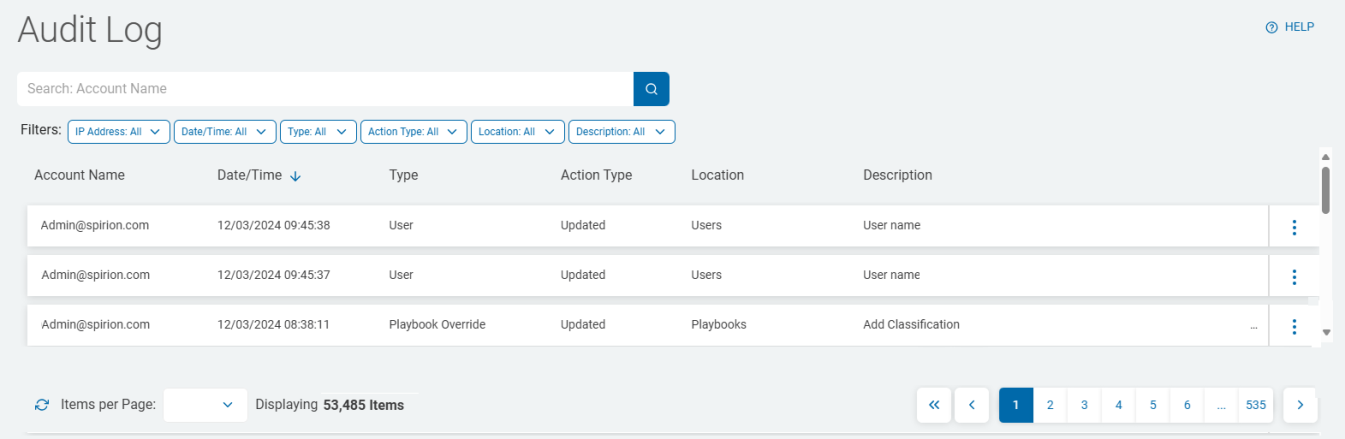
Audit Log Table Columns
The Audit Log table displays these columns:
Field | Description |
|---|---|
Date/Time | The timestamp of when the action occurred. |
Type | The action that was logged:
|
Action Type | The type of action that was taken:
|
Location | The location within Sensitive Data Platform where the action occurred:
|
Description | Includes Action Type, Name, and Type |
More Options menu (3 vertical dots) | View Details |
How to Sort Table Columns
Sort your Audit Logs by table column to instantly bring your desired focus area to the top of the Audit Log table. For example, sort by date to view the oldest or the most recent Audit logs.
Use the following steps to sort table columns:
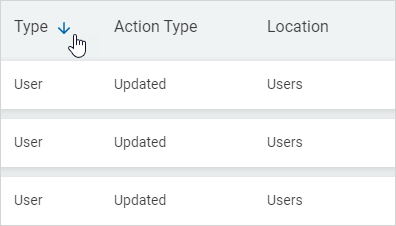
- Click a column to sort ascending.
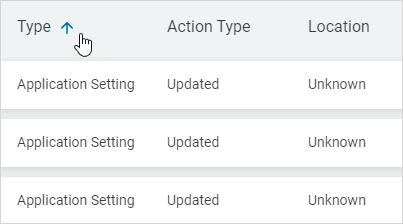
- Click the column again to sort descending.
How to Search for an Audit Log
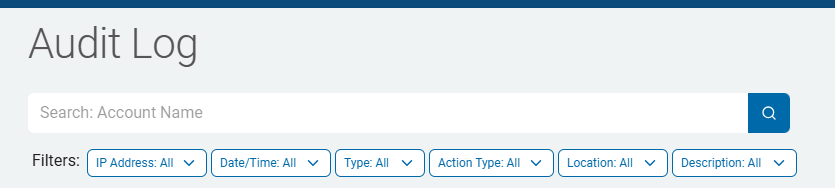
You can search for an Audit log by Account Name, Action Type, or Location.
Use the following steps to search for an audit log:
- Enter the name of the log in the Search entry field.
- Click the magnifying glass (search) icon or press Enter.
- The result displays.
- Click the x to clear the search.
How to View Audit Log Details
Use the following steps to view the details of an Audit log:
- From the Audit Log page locate the log you want to view in the Audit Log list.
- Click the More Options menu at the end of the column.
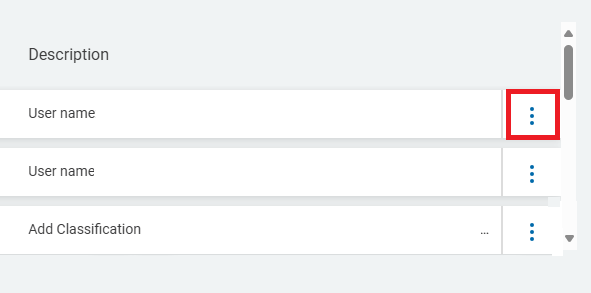
- Click View Details.
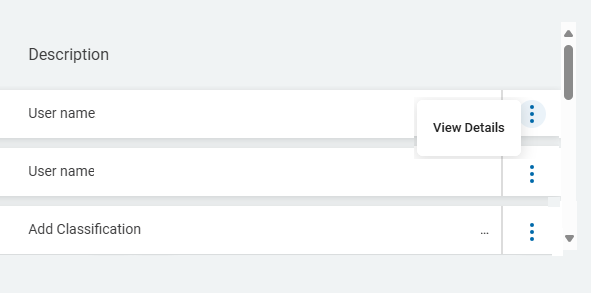
- The Log Details window opens.
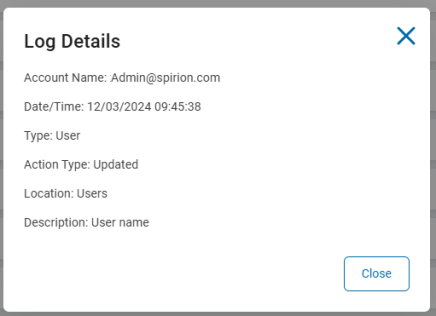
- Click Close to close the window and return to the previous screen.
How to Use Filters to Find an Audit Log
Note: The Type filter only uses and displays event types triggered in Sensitive Data Platform.
To use the filter feature to find an Audit Log based on specific criteria:
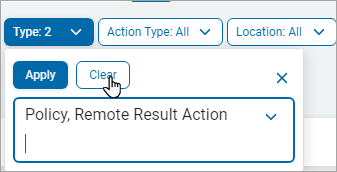
- In the upper left of the screen, go to the Filters.
- For the selection criteria, select one or more items from the list of filters.
- IP Address
- For audits, the user's IP Address is preferred.
- Date/Time
- Type
- Action Type
- Location
- Description
- Click Apply to apply the filter to the Audit Log list.
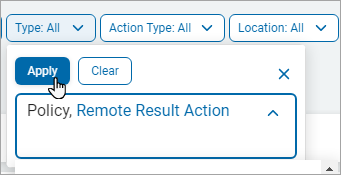
- Click Clear and then click Apply to remove the filter.