
How to Create a Custom Report
To create a custom report use the following steps:
- From the left side navigation menu select Reports > Custom Reports.
- The "Custom Reports" page opens. The CUSTSOM REPORTS tab is selected, by default.
- In the top right corner click the blue + Add Report button.
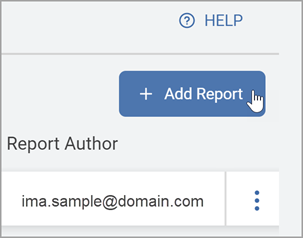
- The Create Report wizard opens.
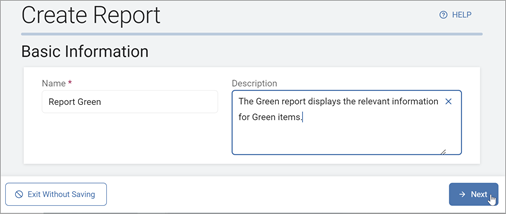
- On the "Basic Information" page, do the following:
- Name: Enter the name of the report (required).
- Description: Enter a short description of the report.
- Click the Next button to proceed or Exit Without Saving button to discard.
- On the "Columns Setup" screen in the Available Columns section, choose from the following to include in your report:
Available Columns
Endpoints Column
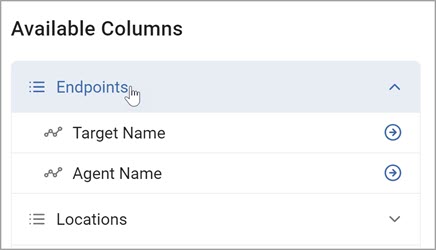
Endpoints can include the following:
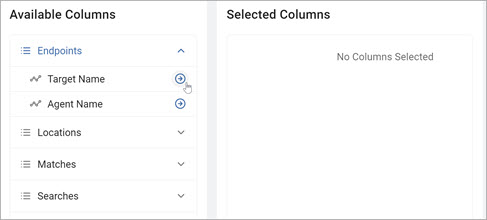
- Target Name: The display name of the endpoint (machine/device) on which the scan results were found.
- This is the hostname or friendly name of the target system that was scanned.
- Sometimes referred to as "Endpoint Name."
- For managed endpoints, this reflects the name registered with the Spirion Sensitive Data Platform console
- For unmanaged endpoints, it shows whatever identifier was used during the scan.
- Agent Name: The display name of the endpoint that performed the search (the source endpoint).
- In distributed scan environments, the Agent that executes the scan may differ from the Target being scanned.
- For example, if Agent Server A scans Target Machine B, the "Target Name" would be Machine B while the "Agent Name" would be Server A.
- Sometimes referred to as "Source Endpoint Name."
- For non-distributed (local) scans, the Agent Name and Target Name are typically the same machine.
Key Distinctions
The Target-Agent distinction is particularly relevant in your distributed scanning architecture, where scans are executed remotely by Agents against separate Target endpoints.
Field | What it identifies |
|---|---|
Target Name | The machine/endpoint where sensitive data was found |
Agent Name | The machine/endpoint that ran the scan |
Locations Column
Locations can include any of the following to refine your report one or more specific locations of your data.
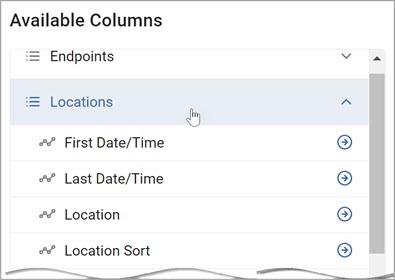
This data can further be sorted in certain categories, for example, "Location Sort":
- First Date/Time: The timestamp (local to the client) of when the location was first discovered during a scan.
- This represents the earliest date/time a match was found at this location.
- Maps to
Date/Time (Discovered)in the data export.
- Last Date/Time: The timestamp (local to the client) of the most recent search during which the location was found.
- If a location appears in multiple scans, this reflects the latest one.
- Maps to
Date/Time (Most Recent)in the data export.
- Location: The full path or identifier of where the match was found — enough information to get back to the source.
- Examples: a file path relative to the client, email message folder/subject, database table and column information, or a full URL for website locations.
- A file path example would be: C:\Desktop\NewFolder\Data
- Location Sort: Use this setting to sort by multiple locations.
- This field is a normalized or simplified representation of the location string intended for consistent alphabetical/logical sorting in report output.
- This field is useful when the raw Location path contains characters or prefixes that would produce an unintuitive sort order.
- File Type: The type of file or location of the result
- Examples: PDF File, E-Mail Message, DOCX, Firefox Browser Data
- In the data export this is described as "type of file identified (pdf, docx, etc.)"
- Example: XLS, Docx, PDF.
- Internal Location Type: The general/broad category of the location type — as opposed to the more specific File Type.
- Provides a high-level classification of the asset type being scanned.
- Example: Cloud, Database, Email, local, etc.
- File Owner: The file system owner for locations that are files. This is the OS-level owner property of the file.
- File Size: The actual size of the file (in bytes).
- Weight: The playbook-assigned priority/weighting value for the location.
- This is a numeric score used to rank findings by importance or risk.
- Maps to
MatchLocations.Weightin the database. - Using this depends on your organization's Weight value settings.
- Data Type Value is the number you assign to the Data Type to give it weight.
- This enables you to add emphasis to certain Data Types to gain insight into your data.
- See Working with Global Data Types for more information.
- Date/Time Created: The timestamp (local to the client) of when the file was created — the file system creation date property.
- Date/Time Modified: The timestamp (local to the client) of when the file was most recently modified — the file system last-modified property.
- Date/Time Accessed: The timestamp (local to the client) of when the file was last accessed — the file system last-accessed property.
- Playbooks: The playbook(s) used in the scan that found the match/location. If multiple playbooks apply, they are listed here.
- See Working with Scan Playbooks for more information.
- Playbook States: The current status of the playbook execution for the location
- For example: Complete, Incomplete, Error, etc.
- Classifications: The classification label(s) that have been applied to the location by a playbook (for example, Confidential, PII, Public). Represents the sensitivity classification assigned to the file or data object.
- These are set by your organization.
- Use this to sort by classifications.
- See Working with Global Classifications for more information.
- Assignees: The console user, role, or endpoint owner to whom the location has been assigned via a playbook for review/remediation.
- Total Matches: The total count of all matches found in the specified location
- For example, a single file might contain 15 SSN matches
- Total Unique Matches: The count of distinct/unique match values found in the location.
- For example, if the same SSN appears 5 times in a file, it counts as 1 unique match but 5 total matches.
Matches Column
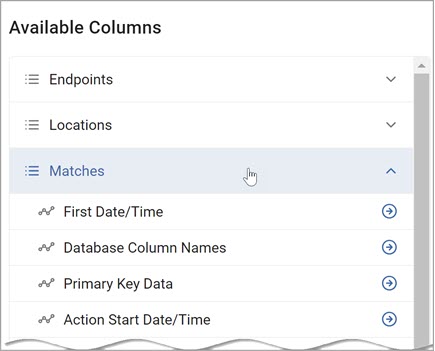
Matches can include any of the following to refine your report by Match results and activities:
- First Date/Time: The timestamp (local to the client) of when the match was first discovered. This represents the date/time of the initial search during which this specific match was found.
- In the Data Export, this maps to "Date/Time (Discovered)" and the database column
Matches.Timestamp.
- In the Data Export, this maps to "Date/Time (Discovered)" and the database column
- Database Column Names: The name of the database column in which the match was found, applicable only when scanning database targets.
- For example, if a Social Security Number is found in a column called
SSNin a SQL table, this field would display that column name. - In the Data Export this is labeled "Database Column Name."
- For example, if a Social Security Number is found in a column called
- Primary Key Data: The primary key value for the row in a database table where the match was found.
- This enables you to trace back to the exact record in a scanned database target that contains the sensitive data.
- In the Data Export this is labeled "Database Primary Key."
- Action Start Date/Time: The timestamp of when a remediation or other action was initiated on the sensitive data match.
- This records the point at which the system began executing an action (for example, quarantine, shred, redact) against the match result.
- Match Count: The number of instances of the match found in the selected location during the most recent search.
- For example, if the same credit card number appears 8 times in a single file, the Match Count would be 8.
- In the ColumnsTab documentation this corresponds to "Match Quantity."
- Action: The most recent action performed on the match result.
- Available values include: None, Ignored, Globally Ignored, Quarantined, Recycled, Redacted, Encrypted, Shredded, No Longer Exists, or Access Restricted.
- Resolution: The final resolved action or state of the match after all processing is complete.
- This represents the end-state disposition of the finding — such as remediation completed, ignored by policy, etc..
- In the Data Export, this is described as "Final action taken, like remediation, etc."
- Data Type: The built-in type classification of the match result — for example, Social Security Number, Credit Card Number, Date of Birth, Driver's License, etc.
- This is the system-defined category that the match was identified as during the scan..
- Data Type Name: The specific sensitive data type name assigned to the rule that identified the match.
- These are the names assigned to Keyword, Regular Expression, Dictionary, Sensitive Data Definition (SDD), or Search API rules configured in the Sensitive Data Types page of the Admin tab.
- This provides a more granular label than the generic Data Type field..
- 13.6 Agents only: If Search API matches exist when the report is run, Search API entries are included in the report results.
- Is Custom Data Type: A boolean flag indicating whether the data type that identified the match is a custom-defined type (for example, a user-created Keyword, Regular Expression, Dictionary, or SDD rule) versus a built-in/standard Spirion data type.
- Useful for filtering reports to show only custom-defined sensitive data findings versus out-of-the-box detections.
Searches Column
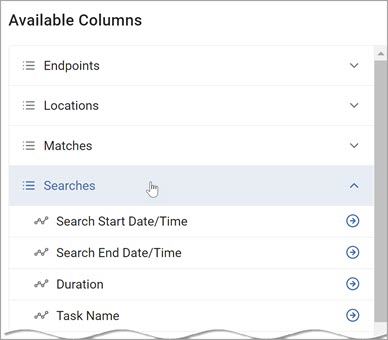
Searches can include any of the following Search criteria:
- Search Start Date/Time: The date and time (local to the client) when the search/scan began executing.
- This marks the start of the scan run that produced the results being reported on.
- Search End Date/Time: The date and time (local to the client) when the search/scan finished executing.
- Together with Search Start Date/Time, this enables you to calculate how long a scan took and when it completed.
- Duration: The total elapsed time of the search/scan run — that is, the difference between Search End Date/Time and Search Start Date/Time.
- Typically expressed in hours, minutes, and seconds.
- Useful for identifying slow or long-running scans.
- Task Name: The name of the scheduled task or scan job that triggered the search.
- This corresponds to the task configured in the Spirion Sensitive Data Platform console (for example, a scheduled scan policy task name), enabling you to identify which task produced the results.
- Location Count: The total number of distinct locations (files, database records, emails, etc.) that were found to contain matches during this search run.
- Provides a high-level count of how many locations were flagged across the scan.
- Scan Name: The name of the scan configuration that was executed.
- This is the user-defined name given to the scan in the Spirion Sensitive Data Platform console, helping you identify which scan policy produced the results.
- Scan Type: An internal numeric or coded identifier representing the type of scan that was run (for example, local file system, database, email, cloud storage).
- This is the system-level classification of the scan method.
- Origin: Indicates the origin or source of the scan — for example, whether it was initiated by a scheduled task, manually triggered, or launched via a specific policy or integration.
- Helps distinguish between automated and ad-hoc scan runs.
- Helps distinguish between automated and ad-hoc scan runs.
Historical Data setting
Before proceeding, set your historical data setting.
Include historical data in the report when applicable
- This setting enables you to generate reports that reflect the state of your sensitive data at a specific point in time, rather than just showing the most recent scan results.
What it does
- By default, Spirion reports typically show the "current" state of your environment (the results of the most recent scans).
- This setting turns a static report into a dynamic historical record. It is the key to performing point-in-time audits and demonstrating long-term data risk reduction.
When this box is checked (enabled)
- Enables Time-Travel Reporting: The report configuration is flagged to include data from the historical database. This enables you to see what sensitive data existed on a specific date in the past.
- Activates the Historical Date Filter: When you view a report that has this setting enabled, a "Historical Date Filter (UTC)" field (with a calendar picker) appears at the top of the report interface.
- Filters by "Action Dates": When you select a date in the calendar, the report reloads to show only the data where the "Match Action Start Date" is less than or equal to your selected date, and the "Match Action End Date" is greater than that date.
Why is this important?
- Trend Analysis: It enables you to prove that your sensitive data footprint is shrinking over time. You can run the same report for "Today" and "Six Months Ago" to compare the total match counts.
- Audit Compliance: If an auditor asks, "What did your PCI data look like on December 31st of last year?," you can use this setting to generate a report for that specific date.
- Remediation Verification: You can verify that data identified in the past has actually been remediated by checking the historical record against current results.
Key Technical Details
- "IsLastForTheDay" Logic: When this setting is active, the reporting engine automatically applies a filter called "IsLastForTheDay." This ensures that if an endpoint was scanned multiple times in one day, the report shows only the results from the final scan of that day, preventing duplicate counts.
- Matches Table Requirement: This setting is only "applicable" if your report includes columns from the Matches table (for example, Match String, Data Type, File Path). If your report only contains high-level endpoint metadata, the historical option may not be available or functional.
- UTC Time: The historical filter operates on UTC time. Depending on your local time zone, you may see results that appear to be off by one day (for example, a scan from late evening on the 1st might show up as the 2nd in UTC).
Best Practices
- Check it for "Executive" Reports: Any report intended for leadership to show progress over time should have this enabled.
- Leave it unchecked for "Action" Reports: If you are creating a report for a technician to go out and delete files today, leave this unchecked so they are only looking at the most current, actionable data.
How to Add Columns to your Report
Use the following procedure to perform custom searches:
- Use the right-pointing arrows to move one or more data types to the Selected Columns section.
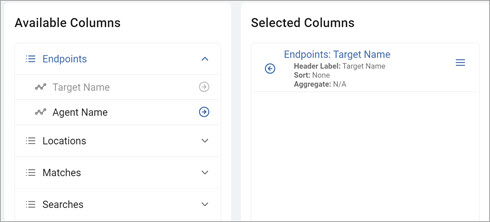
- Use the left-pointing arrows to remove data types.
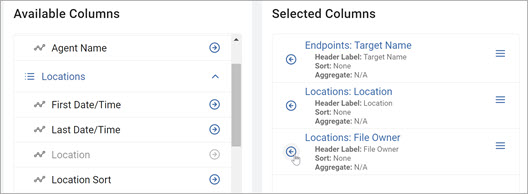
You can change a Column setting or the order of Columns.
How to Edit Selected Columns
To edit Column settings use the following steps:
- In the Select Columns section, hover over the slide drawer navigation icon for the Column you want to edit.
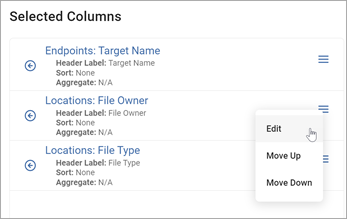
- Click Edit from the drop-down list.
- The "Edit Column Settings" pop-up window appears.
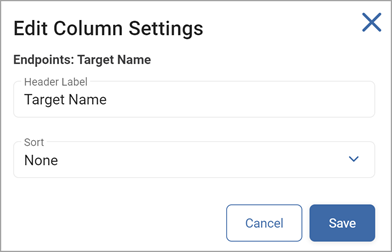
- Make any needed changes:
- Header Label: Enter a new label.
- Sort: Select an option from the drop-down list:
- None
- Ascending
- Descending
- Click Save to save the changes or Cancel to discard.
- To change the Column Order:
- Hover over the slide drawer navigation icon for the Column you want to move.
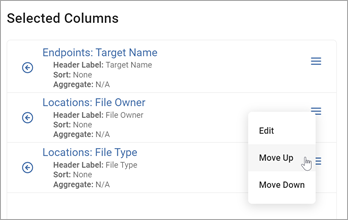
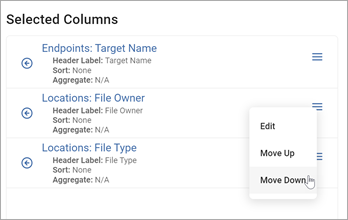
- Click Move Up or Move Down to re-order the Columns
- Click the Next button to proceed, Previous button to return to previous page, or Exit Without Saving button to discard.
- Hover over the slide drawer navigation icon for the Column you want to move.
- The Filters screen opens.
Create Report - Filters Screen
- To apply filtering on a column, choose a column name, the desired operation, and enter the value.
- To include all available data leave the filter value empty and press next.
Procedure:
- Filter a column by the following metrics:
- Column name
- Desired operation
- Specific value(s)
- To include all available data, leave the filter value empty.
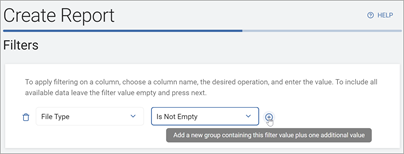
- The "Specific Value" box data type varies based on the option chosen in the Column Name drop-down list:
- File Owner: Enter an Owner Name.
- File Type: Enter a File Type.
- Files Types: Select the more options menu, choose the File Types, and click OK to save or Cancel to discard.
- Target Name: Enter a Target name.
- Tags: Select the more options menu, choose the Tags and click OK to save or Cancel to discard.
- Targets: Select the more options menu, choose the Targets and click OK to save or Cancel to discard.
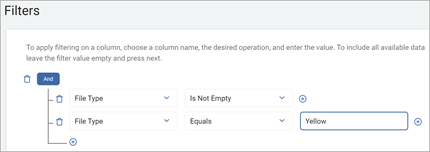
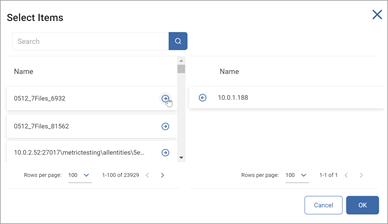
- To add a new value, click a plus icon.
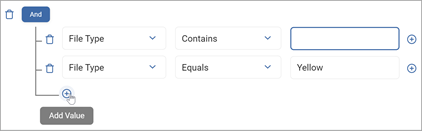
- To remove a value, click a trash icon.
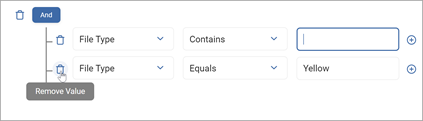
- Use the plus icon to the right of a filter statement to add a new group containing the file plus one additional value.
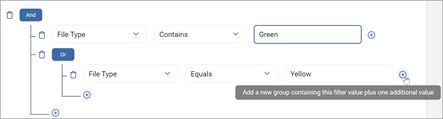
- Toggle to change between AND and OR values.
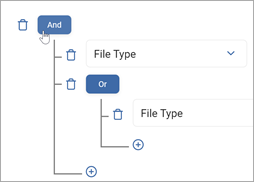
Note: The following examples demonstrate how to use both AND and OR functions to create filters:
Name | Description | Example |
|---|---|---|
AND | All conditions must be met. |
|
AND Single Match | Single condition is met. | Red AND Green: Must contain red and green items. |
AND Group Match | Multiple conditions are met. | (Red AND Green) AND (Red AND White): Must contain both red and green items and red and white items. |
OR | Any of the conditions can be met. |
|
OR Single Choice | Single condition is met. | Yellow OR Blue: Can contain yellow or blue items. |
OR Group Choice | Multiple conditions are met. | Yellow OR Blue OR Green: The matches must contain either yellow or blue or green to be returned. |
- Click the Next button to proceed, Previous button to return to previous page, or Exit Without Saving button to discard.
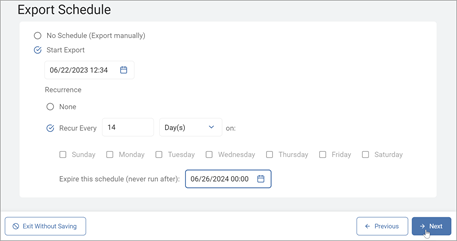
- The Export Schedule screen opens.
Create Report - Export Schedule Screen
About the Export Schedule
Based on the image and the product documentation, here's a breakdown of the Export Schedule options on the "Columns Setup' page, along with common scenarios and recommendations:
1. No Schedule (Export manually)
- The default setting.
- The export will only run when a user explicitly triggers it from the Data Export list in the console.
2. Start Export
- Sets the date and time for the first (or only) scheduled export run.
- The date/time picker shows
07/24/2026 16:11(local to the console timezone).
3. Recurrence
Controls whether the export repeats after the initial run:
- None — The export runs once at the specified Start Export date/time and does not repeat.
- Recur Every [N] Day(s)/Week(s)/Month(s) on: [days of week] — Sets a repeating cadence. You specify the interval (for example, every 1 week) and which days it should run (Sunday–Saturday checkboxes).
4. Expire this schedule (never run after)
- An optional end-date boundary.
- The scheduled export will stop running after this date, even if a recurrence is configured.
- If left blank, the schedule continues indefinitely.
Common Scenarios & Recommendations
Scenario | Configuration | Recommendation |
|---|---|---|
Ad-hoc / on-demand exports | Select "No Schedule (Export manually)" | Best for one-off compliance checks or generating data exports before a specific audit. No recurring overhead. |
Weekly compliance report | Start Export = next Monday at desired time; Recur Every 1 Week on Monday | Ideal for teams that review sensitive data posture weekly. Schedule it after your weekly scan completes (for example, if scans finish Saturday night, schedule export for Monday morning). |
Daily operational monitoring | Start Export = tomorrow; Recur Every 1 Day(s) | Good for environments with high data churn or active remediation. Aligns fresh export data with daily review workflows or SIEM ingestion. |
Monthly executive reporting | Start Export = 1st of next month; Recur Every 1 Month | Suitable for producing monthly summaries for leadership or audit committees. Use the Expire date if reports are only needed for a specific compliance period. |
Time-limited engagement (e.g., audit window) | Configure recurrence + set "Expire this schedule" to audit end date | Prevents orphaned recurring exports from running indefinitely after the reporting need has passed. |
Post-scan export sync | Schedule the export to start after the data warehouse ETL job has refreshed (typically a few hours after scan completion) | Ensures the export captures the latest scan results rather than stale data from the previous warehouse refresh cycle. |
Key Considerations
- Timing relative to data warehouse refresh — Exports query the reporting/data warehouse tables, not the live operational database.
- Schedule exports after the ETL/refresh job completes to ensure fresh data.
- Per the architecture, the reporting database is populated on a configurable schedule (default ~24 hours).
- Export retention — Generated CSV exports are retained in storage for a limited window (default 24 hours per the PRD).
- If you need the file longer, download it promptly or configure your external tool (Power BI, Tableau, Splunk) to pull it on a matching cadence.
- Large exports — If your export configuration produces a very large file, avoid scheduling it during peak console usage hours.
- Off-hours (nights/weekends) are preferred.
- Expire date best practice — Always set an expiration for temporary or project-scoped schedules to avoid unnecessary load once the reporting need ends.
How to Add an Export Schedule to your Report
Procedure:
- Choose to schedule the export or manually export (immediate export):
- No Schedule: Export manually.
- Start Export:
- Date: Select a start date from the date picker.
- Recurrence: Select one of the following:
- None: No recurrence.
- Recur Every:
- Enter a duration number.
- Select an option from the calendar term drop-down list.
- Select the day of the week (if applicable)
- Expiration: Select a schedule expiration date from the calendar picker (if applicable).
- Click the Next button to proceed, Previous button to return to previous page, or Exit Without Saving button to discard.
Create Report - Summary Screen
Procedure:
- On the "Summary" screen, review the report details to ensure accuracy by clicking the Generate Report Preview button.
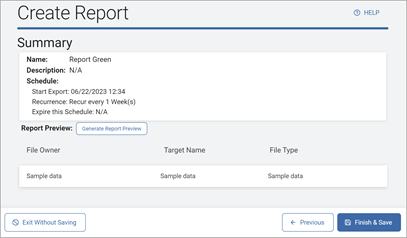
- Click the Finish & Save button to save the report, Previous button to return to the previous page, or Exit Without Saving button to discard.
- Click the Confirm button to generate the preview or Cancel button to discard.
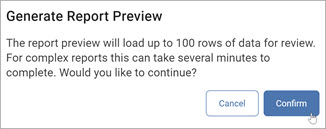
Note: The report preview loads up to 100 rows of data for review. For complex reports this can take several minutes to complete.
Note: See How to Create Your Own Custom Reports for detailed examples of reports.