Spirion PostgreSQL and PgBouncer Agent Queuing (v13.6+)
New in version 13.6 is the Spirion PostgreSQL and PgBouncer Agent queuing system.
Architecture
The new PostgreSQL database architecture replaces the Erlang/RabbitMQ architecture of the v13-13.5 greyhound Agents.
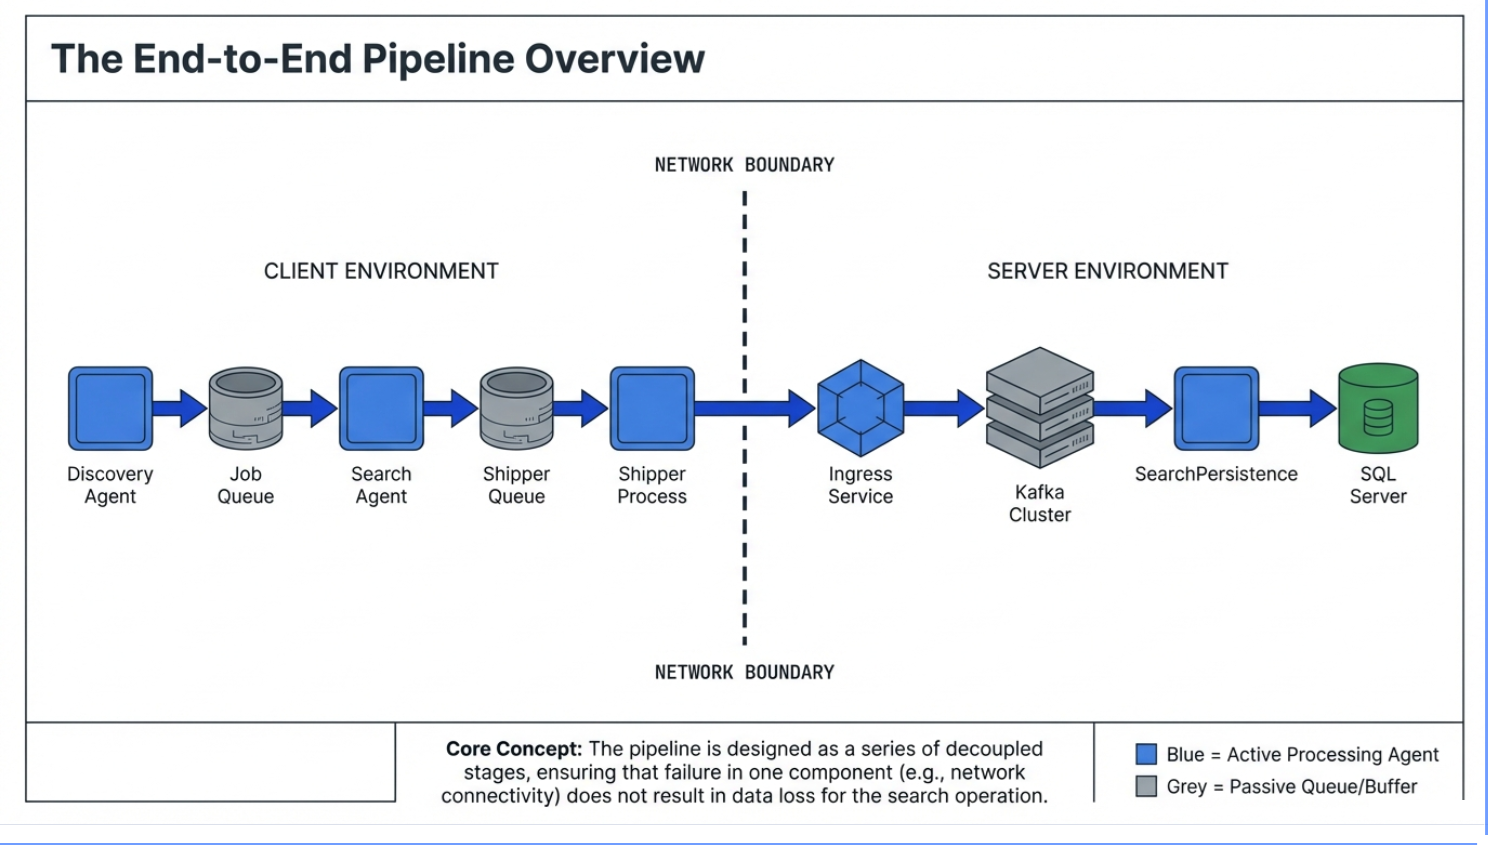
This diagram below shows the full journey of scan work and scan results—from an endpoint (client environment) all the way into the server-side systems.
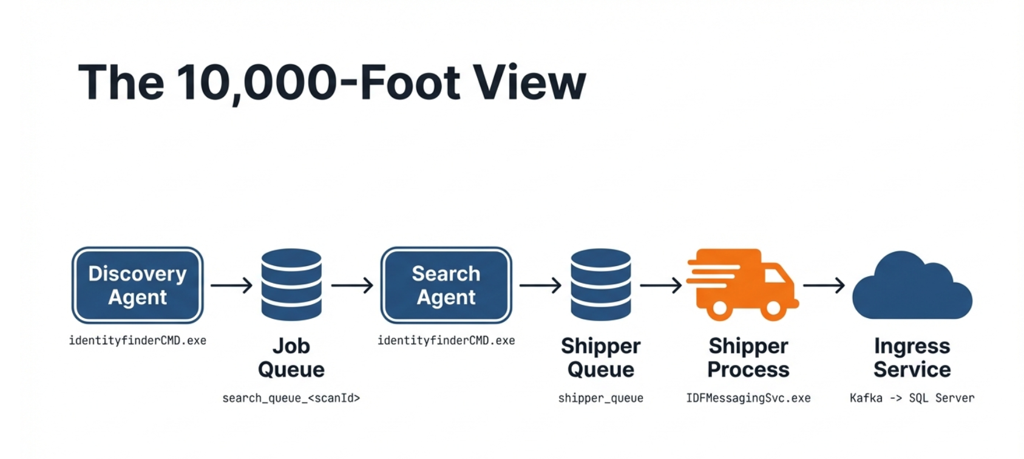
1) Discovery finds what needs to be searched (Client side)
- The Discovery Agent figures out what targets/locations should be searched (for example: which folders, shares, or endpoints).
- It does not do all the searching itself—it creates a “to-do list” of work.
2) Work is placed into the Job Queue (Client side)
- That “to-do list” is saved into the Job Queue.
- Think of this as a checkout line: workers (search agents) can grab the next item when they’re ready.
- This queue is intentionally “durable,” meaning if a machine restarts, the work list can still be there.
3) Search Agents pull work and perform the search (Client side)
- One or more Search Agents pull jobs from the Job Queue.
- They perform the actual searching/scanning work on the customer’s environment.
4) Results are placed into the Shipper Queue (Client side)
- As Search Agents find results, they don’t immediately send them across the internet.
- Instead, results are written to the Shipper Queue—a holding area for “results waiting to be sent.”
- This protects against temporary network interruptions so results are not lost.
5) Shipper Process sends results to Spirion (Crossing the network boundary)
- The Shipper Process reads from the Shipper Queue and sends results to Spirion’s Ingress Service.
- If the network is slow or unavailable, results remain queued locally until they can be delivered.
6) Server-side ingestion and storage (Server side)
Once results reach Spirion:
- Ingress Service receives the payloads.
- Data is buffered through the Kafka Cluster (helps absorb load and keep things reliable).
- SearchPersistence processes and writes the data into the final SQL Server database.
Why it’s designed this way
This pipeline is decoupled into stages so that:
- Searching can continue even if shipping is temporarily delayed, and
- Shipping can resume later without losing results.
A problem in one stage doesn’t automatically erase work or results—it usually just means something is “waiting” at the stage where the interruption occurred.
Two Internal Queues
Spirion agents prior to 13.6 relied on RabbitMQ for two internal queues.
Those queues now run on a small local PostgreSQL database (with pgBouncer as a lightweight connection “traffic cop”) resident on each agent machine.
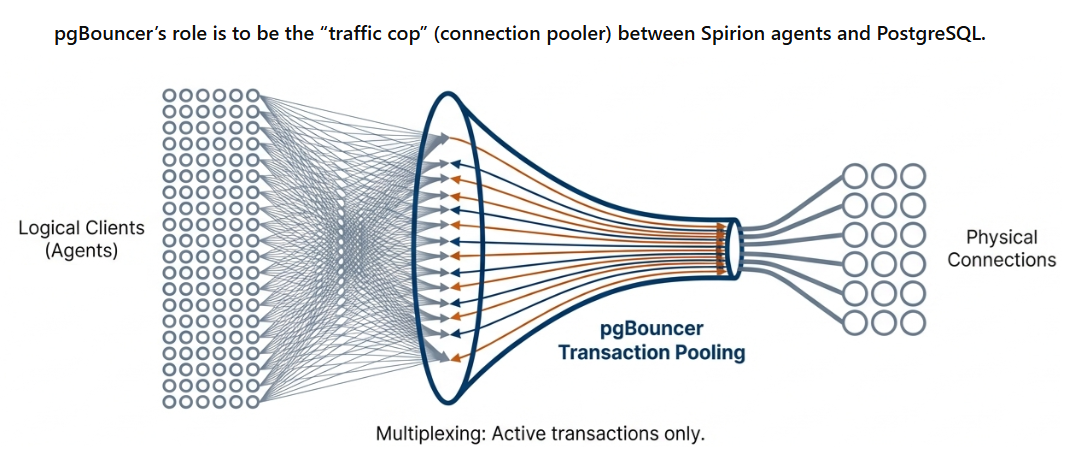
Benefit of new queueing architecture: The new queueing architecture simplifies installation, reduces resource usage, and makes recovery more predictable when a machine or network has a hiccup.
What Does “queue” Mean?
A “queue” is a table in the local PostgreSQL database.
- Each “item in the queue” is a row in that table.
- Items are “moved” through the queue by changing the row’s state/status (example: Pending → Processing → Failed → PermFailed).
Queue = table, item = row, progress = status change
Job Queue and Shipper Queue
- Job Queue (per scan): A list of “places to search” that search agent workers pull from.
- Shipper Queue (always on): A durable list of “results waiting to be sent” to Spirion cloud services (Ingress).
In the Spirion Windows agent architecture (introduced in version 13.6), the legacy RabbitMQ messaging system has been replaced by a local PostgreSQL database. This database uses two primary types of queues to manage the flow of a scan.
The high-level difference is their purpose: the Job Queue manages the work to be done (Discovery to Search), while the Shipper Queue manages the results waiting to be delivered (Search to Console).
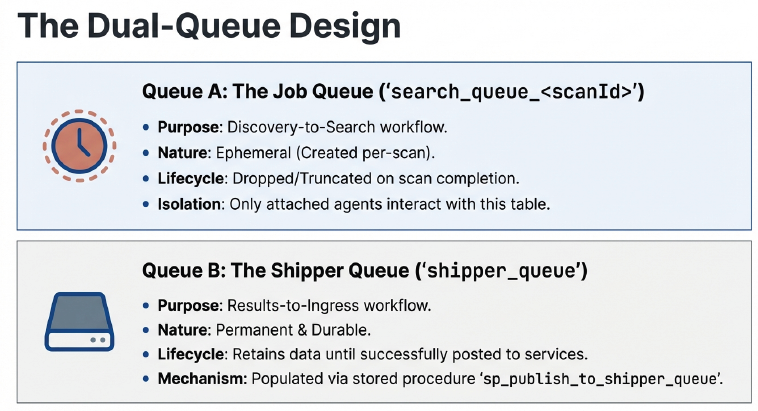
Job Queue (search_queue_<scanId>)
This queue acts as the "To-Do List" for a specific scan.
- Scope: Per-scan. A new table is created for every unique scan (e.g.,
search_queue_GUID). - Producer: The Discovery Agent (thread) populates this queue with "jobs" (specific files, folders, or locations that need to be searched).
- Consumer: One or more Search Agents pull jobs from this queue to perform the actual inspection.
- Lifecycle: It is temporary. It exists for the duration of the scan and is typically cleaned up after the scan completes and a grace period (for example, 15 minutes) expires.
- Distributed Scanning: In a distributed scan, the Job Queue lives on the "Discovery" machine. Remote Search Agents connect to this central Postgres instance via pgBouncer to claim work.
Shipper Queue (shipper_queue)
This queue acts as a "Durable Staging Area" for scan results.
- Scope: Permanent. This is a single, constant table that exists as long as the agent is installed.
- Producer: Search Agents write rows into this table as soon as they find sensitive data or complete a file scan.
- Consumer: The Shipper Process (
IDFMessagingSvc.exe) reads from this queue and attempts to post the data to the Spirion Ingress Service (Cloud). - Resilience: Its primary job is to protect data against network interruptions. If the endpoint loses internet connectivity, results stay safely in this local Postgres table until the connection is restored.
- Lifecycle: Rows progress from Pending to Processing and are only deleted (or moved to a processed state) once the Ingress service confirms receipt.
Comparison Summary
Feature | Job Queue | Shipper Queue |
|---|---|---|
Primary Goal | Distribute work to workers. | Guarantee delivery of results. |
Table Name |
|
|
Longevity | Created per scan; temporary. | Permanent; always on. |
Who puts data in? | Discovery Agent | Search Agent |
Who takes data out? | Search Agent(s) | Shipper Process ( |
Analogy | A checkout line for workers. | An "Outbox" for mail. |
Key Statuses for Both Queues
In both tables, you can track progress by looking at the status column:
- 0 (Pending): Waiting to be claimed.
- 1 (Processing): Currently being worked on by a process.
- 2 (Processed): Successfully completed.
- 3 (Failed): Encountered an error; may be retried.
- 4 (PermFailed): Retries exhausted; will not be attempted again.
Services/Processes
These are the “moving parts.”
These names appear in logs and in troubleshooting.
On the endpoint
- PostgreSQL (local) – Stores queue rows durably (replaced RabbitMQ).
- pgBouncer – Connection pooling to keep resource usage small.
- idfEndpoint.exe (EPS) – Ensures the database schema exists and runs background queue cleanup/retry logic.
- identityfinderCMD.exe (IDF / SystemSearch) – Does discovery/search work and writes results into the shipper queue.
- IDFMessagingSvc.exe (IFS / Shipper) – Sends queued results to server-side Ingress.
Key Terms
- “Pending / Processing / Failed / Permfailed: Basic queue states (waiting / in progress / had trouble / permanently failed).
- “Heartbeat”: a periodic “I’m alive” update from an agent; used to auto-recover abandoned work.
Best Practices for Common Issues
Confirm Queue Components are Running
Check services.
Are the following services running?
- PostgreSQL
- pgBouncer
- IDFMessagingSvc (shipper)
Provide the Following Logs to archTIS Support
- SystemSearch / IDF logs (identityfinderCMD)
- Endpoint Service / EPS logs (idfEndpoint.exe)
- Shipper / IFS logs (IDFMessagingSvc.exe)
Typical locations (may vary by version):
- Windows:
%ProgramData%\Identity Finder\Logs\
- Provide Gather Data ZIP file if necessary
- Services Side logs: Ingress and Search Persistence Services logs
Recommended Troubleshooting Methods
Follow data through the pipeline to find the root cause
Symptoms often show up “later” than the cause.
When troubleshooting, trace the data through each stage:
- Discovery → Job Queue → Search → Shipper Queue → Shipper → Ingress → Server storage
Find the last stage that is working and the first stage that is failing. The root cause is typically between those two points.
- See the following page for instructions on conducting this investigation: How to Follow Data Through the Search Pipeline
Port 5671
- Port 5671 is a RabbitMQ message.
- Newer logging shows Postgres/pgBouncer ports.
- Port 5671 appearing in logs and messages can indicate older components/log messages.
Distributed scans failing due to “can’t reach the queue host”
- In a distributed scan, search agent endpoints must reach the discovery endpoint’s pgBouncer/Postgres connection.
- Firewalls or port configuration issues can make search agents time out waiting for the queue.
“Waiting for queue to be empty” is not typically a failure
Spirion Search Agents may legitimately wait, especially when the following is true:
- Discovery is still analyzing locations and hasn’t posted eligible work yet (filters/criteria can make this seem slower).
- A distributed scan is finishing up and search agents must wait for all agents to complete so jobs don’t get re-queued.
“Processing” isn’t always bad—there’s auto-recovery
If an agent crashes mid-job, the system uses heartbeats to detect staleness and re-queue abandoned work automatically (often within about a minute).
Common Causes of Issues
Port Mismatches (most common configuration issue)
Default ports:
- PostgreSQL: 5433 (used instead of PostgreSQL default port to avoid collision with any possible traffic on port 5432)
- pgBouncer: 6433 (used instead of pgBouncer's default to avoid collision with any possible traffic on port 6432)
Some environments may use 5432/6432 (older/special configs).
Ensure consistency across your Agents and any required firewall rules.
Search Agents “waiting for queue”
Search agents can wait up to a configured window of time for the per-scan job queue to appear. This is usually not a problem unless search agents time out and exit.
Note: If the discovery endpoint is offline, the job queue is offline too.
Shipper logs may be less obvious in some versions
Shipper logging may not always show detailed “destination URL / message count” information depending on build. Logs are still essential if results are missing.