How to Work with Scan Results - Overview
Purpose and Overview
The Scan Results page serves as the central, unified repository of all sensitive data findings generated by scans across an organization's data landscape.
It provides administrators and data governance teams with a comprehensive, queryable view of every individual match or discovered item across all scan types, targets, and time periods — giving them the operational intelligence needed to act on sensitive data at scale.
The Scan Results page is the "Evidence Locker" and "Triage Center" of the Spirion Sensitive Data Platform. It is where the raw output of your scans is transformed into actionable findings.
- You can search for scans based on different criteria and filter views.
It's important to remember:
- There are two types of scans:
- Discovery Scans
- A Discovery scan is the enumeration phase. Its primary function is to connect to a target and catalogue what's there — indexing files, folders, mailboxes, database tables, or other storage objects — without necessarily performing deep content inspection for sensitive data patterns.
- Think of it as mapping the terrain: the Discovery Agent enumerates the contents of a target and coordinates what needs to be searched. The output tells the system where data lives, not necessarily what it contains.
- Labeled DISCOVERY in the Scan Results page tab strip
- Abbreviated as DS in scan type shorthand
- Does not require a configured Scan Playbook to run
- Cannot be run as a Distributed scan (Distributed implies SD only)
- Does NOT support a DIFF modifier (scan only what has changed since the last run)
- Sensitive Data Scans
- A Sensitive Data scan is the content inspection phase. It performs the actual search operations against configured targets, applying data type rules, Sensitive Data Definitions (SDDs), and policies to identify and classify sensitive content — PII, PHI, PCI, intellectual property, etc.
- The Search Agent performs these operations, producing structured findings that flow through the results pipeline into the console.
- Abbreviated as SD in scan type shorthand
- Always associated with a Scan Playbook for remediation actions
- Supports a Distributed variant for large-scale parallel scanning
- Supports a DIFF modifier (scan only what has changed since the last run)
Core Functions and Value
1. Aggregate Visibility Across All Scans
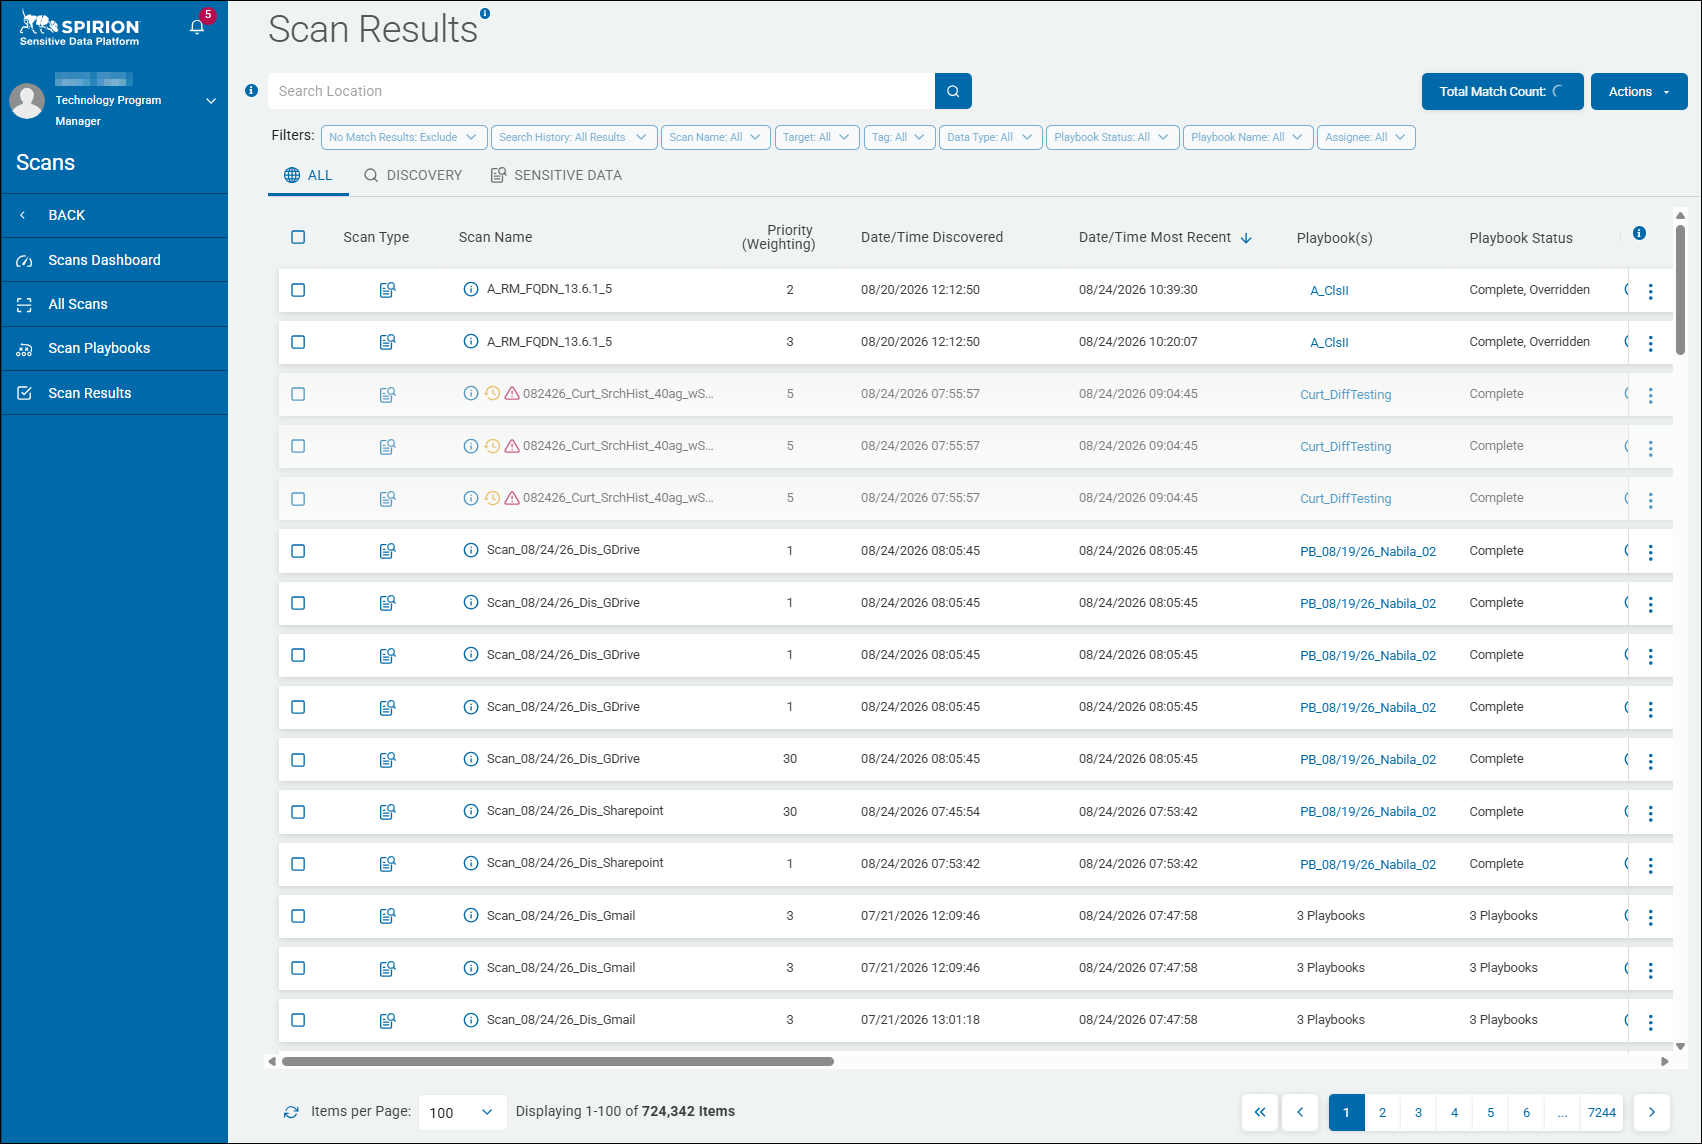
The page consolidates results from every scan in the system — in the example image above 724,342 items across 7,244 pages are displayed — providing a single authoritative source of truth for all sensitive data findings. Rather than navigating into each individual scan, users can review the entire result set from one location.
2. Scan Type and Classification Context
Each result row identifies the Scan Type (via icon) and Scan Name, giving users immediate context about the nature of each finding — whether it originated from a Discovery scan or a Sensitive Data scan. The tab strip at the top (ALL / DISCOVERY / SENSITIVE DATA) enables users to filter results by scan category, enabling focused review of specific finding types.
3. Prioritization via Weighting
The Priority (Weighting) column surfaces each result's relative risk or importance score. This allows administrators to triage the most critical findings first, rather than processing results in arbitrary order. Priority values visible in the screenshot range from 1 to 30, enabling risk-ranked remediation workflows.
4. Temporal Tracking
Two date/time columns provide critical lifecycle intelligence:
- Date/Time Discovered — when the sensitive data item was first identified, establishing the original exposure window.
- Date/Time Most Recent — the timestamp of the most recent scan activity against that item, confirming whether findings are current or stale.
Together, these columns support compliance reporting requirements (for example, "when was this data first found?") and help teams assess whether a finding has been re-confirmed in the latest scan cycle.
5. Playbook Association and Execution Status
The Playbook(s) and Playbook Status columns show which automated remediation or policy enforcement playbooks have been applied to each result, and whether those playbooks have completed. Statuses visible include Complete, Complete, Overridden, and aggregated indicators like 3 Playbooks, indicating multiple playbooks in use.
This closes the loop between detection and remediation — users can see not just that data was found, but what action was taken in response.
6. Rich Filtering and Search
The filter bar provides granular slicing across multiple dimensions simultaneously (details further below):
- No Match Results (include/exclude)
- Search History
- Scan Name
- Target
- Tag
- Data Type
- Playbook Status
- Playbook Name
- Assignee
The Search Location field further enables free-text search against file paths or storage locations. This makes the page useful for both broad compliance audits and highly specific investigations (for example, "show me all unresolved findings in SharePoint assigned to a specific user").
7. Bulk Actions
The checkbox column and Actions button (top right) allow administrators to select multiple results and apply bulk operations — such as assigning playbooks, updating status, or exporting findings — dramatically reducing the manual overhead of processing large result sets.
8. Total Match Count
The Total Match Count indicator in the top-right corner provides an at-a-glance summary metric of the overall sensitive data exposure volume, useful for executive reporting and trending over time.
Summary Value Proposition
The Scan Results page is the operational heart of the Spirion platform's data discovery workflow. It bridges detection (what sensitive data exists, where, and since when) with remediation (what playbooks have been applied and at what status), empowering data governance teams to maintain ongoing compliance, demonstrate audit readiness, prioritize remediation by risk, and investigate specific data exposure events efficiently.
How to Sort Scan Results
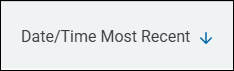
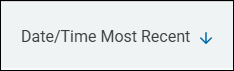
The blue arrow next to a column heading indicates what metric is being used to sort the scan result shown.
- By default, scan results are shown sorted by the Date/Time Most Recent table column.
- Select any column head to sort your scan results by that column metric.
Scan Results help you understand:
- What data is being scanned
- What type of scan was run, such as "Discovery" or "Sensitive Data" scan
- Date of the scan
- Playbook(s) used by scans
- What Data Types (bank account numbers, driver license numbers, social security numbers, etc.) were found
- Who owns the Targets being scanned
- Location(s) of the sensitive data discovered by the scan
- Results and resolution status of the scans
More information about the information revealed by the Scan Result table is given below, as well as in the tooltips on the "Scan Results" page itself in Spirion Sensitive Data Platform.
How to View Scan Results
To view Scan Results use the following steps:
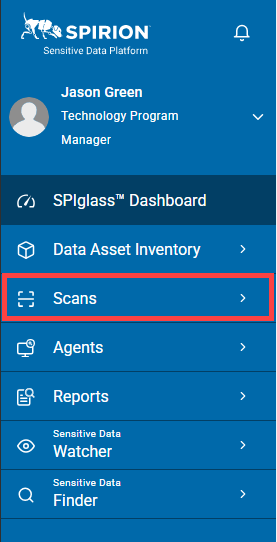
- From the left side navigation menu, click Scans.
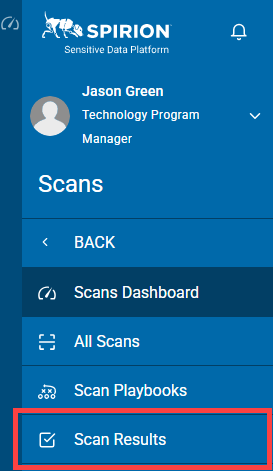
- Next, click Scan Results from the navigation menu.
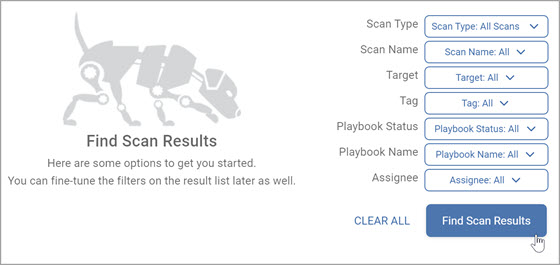
- The Find Scan Results page displays.
- From the selection criteria on the right, select options from the drop-down list to sort scan results and click Find Scan Results. Else, just click Find Scan Results.
- The "Scan Results" page opens.
- Scans Results are displayed in a list sorted by column.
- NOTE: The blue arrow next to a column heading indicates what metric is being used to sort the scan result shown. By default, scan results are shown sorted by the Date/Time Most Recent column. Select any column head to sort by that column metric.
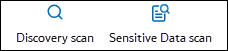
- Scan Type - Either Discovery (metadata only) or Sensitive Data scan.
- See the icons below.
- Note that Discovery scans scan for metadata only, they do not scan for sensitive data.
- Scan Name - Name of the scan. Click the icon to see a history of scans that have found the location (shown in the location column).
- Priority (Weighting) - Calculated from the weight assigned to the playbook decision combined with playbook nodes directly after the playbook, the data type weights, and the number of matches in a given location.
- Date/Time Discovered - Date/time the location was discovered (Discovery scan). First date/time a match was discovered in the location (Sensitive Data scan). Does not change if the location is discovered multiple times.
- Date/Time Most Recent - The most recent time a scan found the location.
- Playbook(s) - List of every playbook that has been used by any scan that found this location. Mouse over entry for more information.
- Playbook Status - Status of each playbook from the Playbook(s) column. Mouse over entry for more information.
- Examples: Processing, Complete, User action required (such as manual input needed), User intervention required (such as file cannot be redacted, action failed), etc.
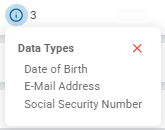
- Data Type(s) - Sensitive data types found in the location (social security numbers, credit card numbers, SIN, etc.).
- Example 1: A scan searches for 10 data types, but a given location contains only 1 data type.
- Example 2: Multiple data types are in the same location: Date of Birth, E-Mail Address, Social Security Number. See below.
- Classification(s) - Classifications of the data captured by the scan (Classified, Secret, Top Secret, custom classifications, etc.)
- Location - Location from your scan where sensitive data matches were found. This is the full file path to the file that contains the sensitive data (social security numbers, credit card numbers, etc.) discovered. Triple-click any Location and copy it, if desired, for entry elsewhere in Spirion Sensitive Data Platform, such as the Global Ignore Lists (Admin users only) on the "Scans Settings" page.
- Location Examples:
- C:\Passwords\passwords.txt
- \\20.60.220.111\project-Adam-files\myproject\addresses.txt
- Google Drive: smithj@myCompany.net/ProjectData.docx
- https://MyCompany.sharepoint.com/ProjectA/Shared Documents/SensitiveData.docx
- Location Type - The type of location. File, SharePoint, Cloud E-Mail Message, Cloud E-Mail Attachment, etc. This information is required for any Location (file path) entered into the Global Ignore List (Settings → Application Settings → Scans Settings → Global Ignore Lists).
- Match Count - The count of sensitive data matches found in the location.
- This count can include matches from multiple different scans. It simply counts the data matches linked to the location. If a scan finds 10 instances of the same SSN in a location, the count is 10, not 1.
- Most Recent Action - Most recent playbook action taken (sensitive data file shredded, redacted, classified, etc.). Click the icon for recent action history.
- Agent Scanning - Agents performing the scan that discovered the location.
- Target Being Scanned - Target being scanned
- File Owner - Owner of the Location file
- Assignee - User or role is assigned to a location via a playbook Assign card.
Sample Scan Results - 1st half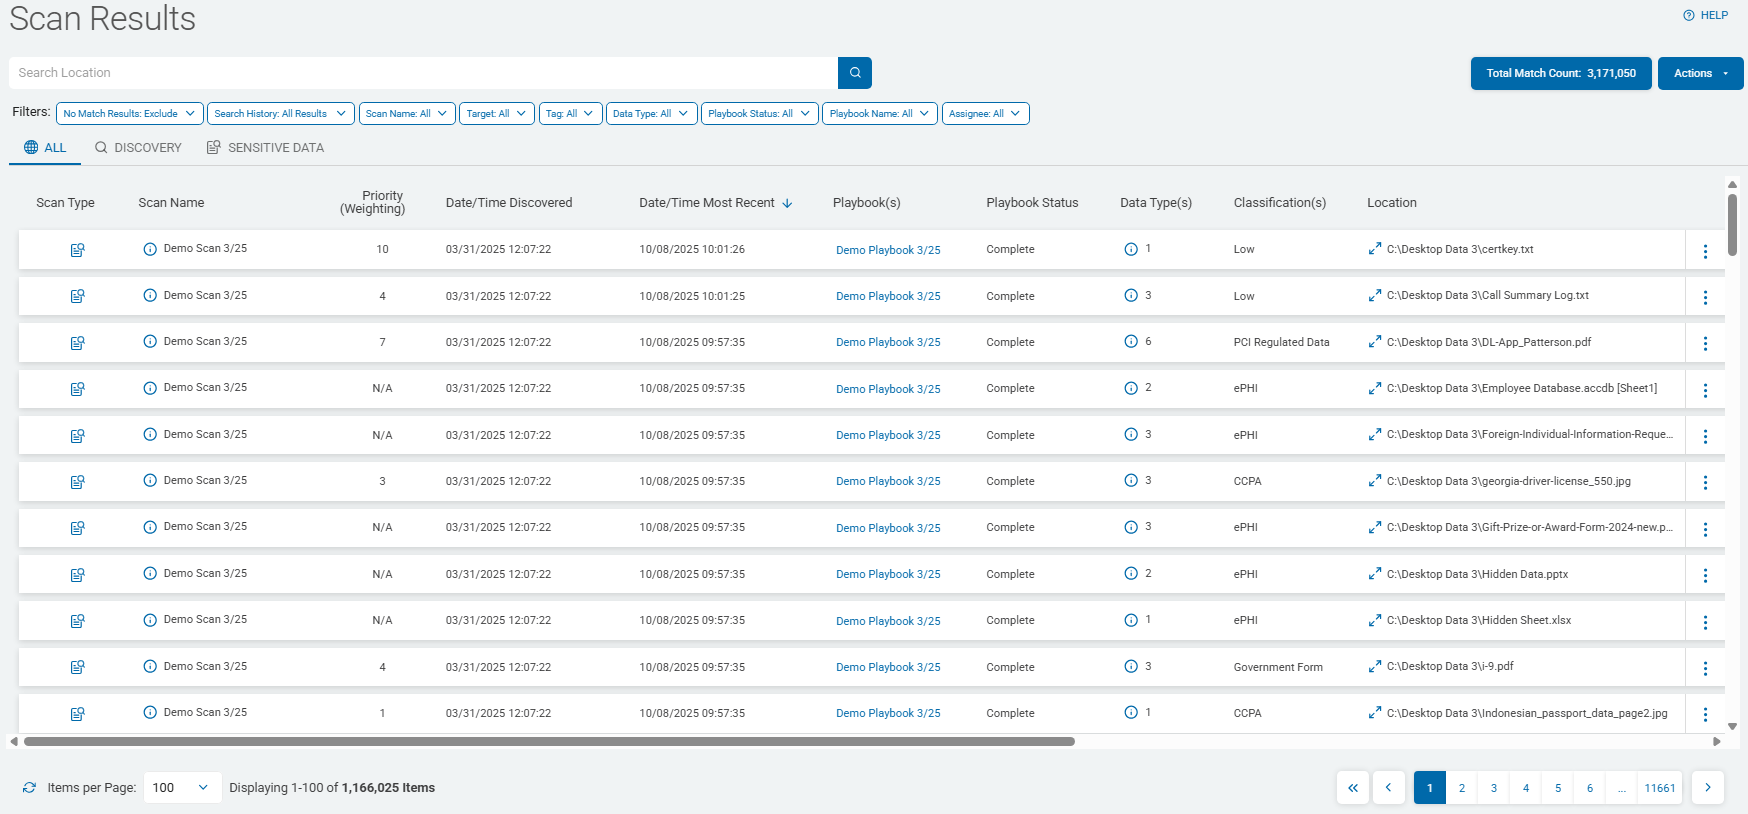
Sample Scan Results - 2nd half (scroll right)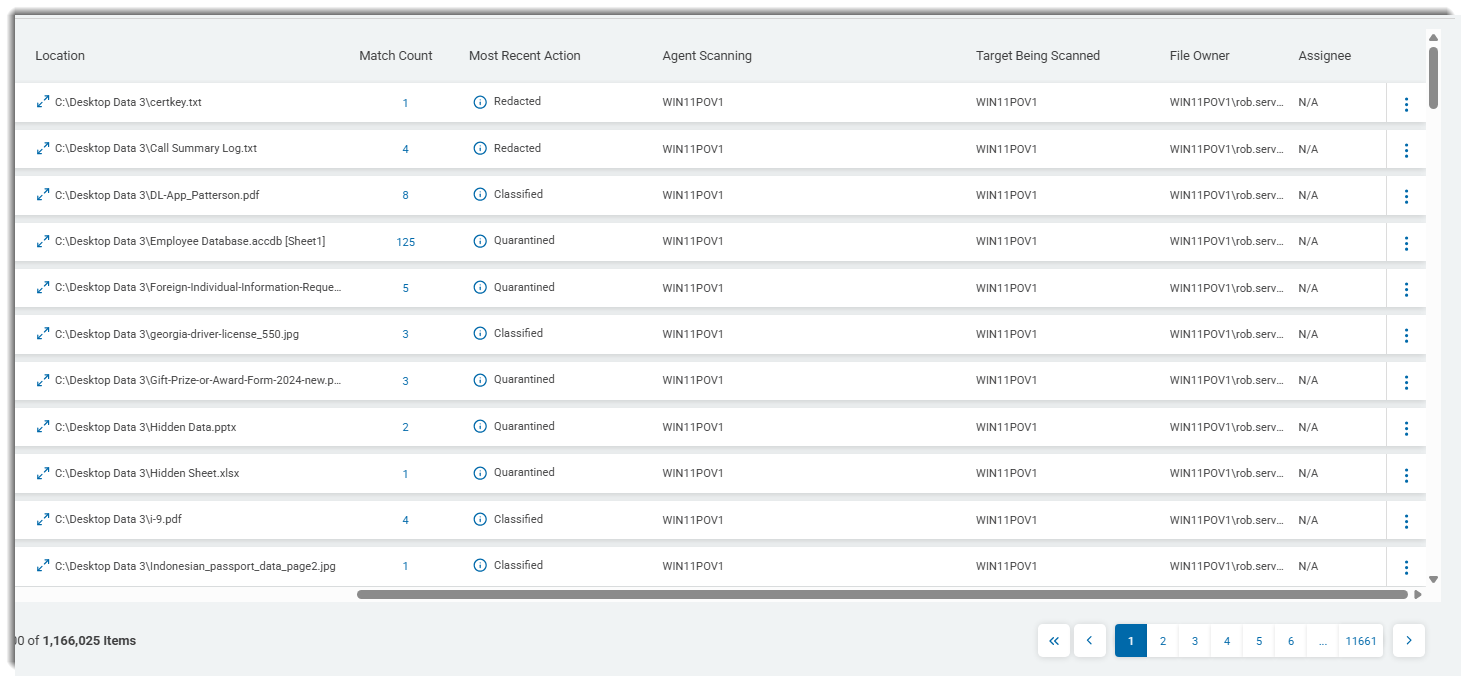
- NOTE: The blue arrow next to a column heading indicates what metric is being used to sort the scan result shown. By default, scan results are shown sorted by the Date/Time Most Recent column. Select any column head to sort by that column metric.
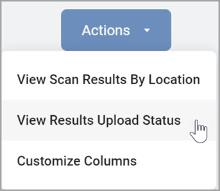
- You can further sort the results as follows:
- Click Actions.
- Select any of the following options:
- View Scan Results by Match - View scan results by sensitive data match, such as
- View Results Upload Status -
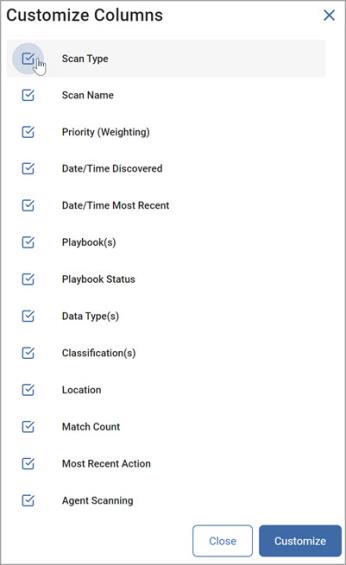
- You can Customize the Columns:
- Click Actions.
- Select Customize Columns.
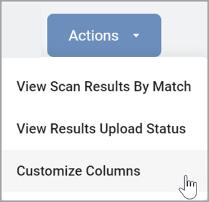
- Select the columns you want to display and click Customize.
- See "Customize Scan Results Columns" for more information.
- See "Customize Scan Results Columns" for more information.
- Use Filters to locate scans using specific criteria.
- See "Using Filters to Find Scan Results" for more information.

- See "Using Filters to Find Scan Results" for more information.