
How to Create a New Policy Using the Create Policy Wizard
What is the Create Policy Wizard?
The Create Policy wizard in Spirion Sensitive Data Platform (SDP) v13.6+ is the primary interface for defining how Agents behave, what they search for, and how they report results. It is structured as a multi-step process that translates your governance intent into a policy.xml file delivered to the Agents.
Wizard Structure & Key Steps
The wizard is typically organized into the following logical steps:
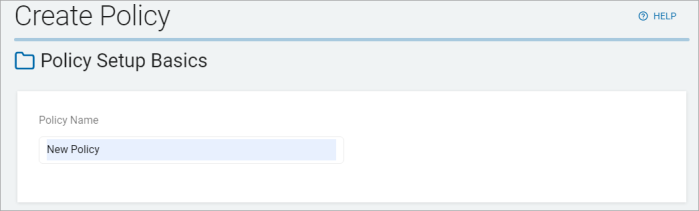
1. Policy Setup Basics
- Policy Name: The unique identifier for the policy in the console.
- Installation Path: Defines where the Agent is installed on the endpoint.
- Log Level: A slider (0-4) that determines the detail of local Agent logging.
- Max HD Usage: Controls the "safety valve" for disk space, enabling you to stop scans if free space falls below a certain percentage or GB threshold.
2. Watchdog and Proxy Policy Setup
- Watchdog Service: Configures the service that monitors and restarts the Agent if it fails.
- Proxy Settings: If Agents must communicate through a proxy, you define the IP, Port, and credentials here.
3. File and Folder Policy Settings
- Inclusions/Exclusions: Defines the specific paths on the local file system that the Agent should (or should not) scan.
4. Agent Operations (Basic & Advanced)
This is the "engine room" of the policy.
- Basic: Controls how often the Agent checks the console for policy updates.
- Advanced Options: Contains critical architectural settings such as:
- Enable Startup Checks: Diagnostic tests run at service start.
- Use FQDN / Host / Computer Name: Controls how the Agent identifies itself.
- Results Storage Mode: Switches between Memory Mode (fast) and On-disk Database (resilient).
- Temp File Management: Settings for Temp File Location and Shred Intensity.
- Cloud Remediation: Controls handling of previous file versions in M365/SharePoint.
5. Additional Settings (Local Interface)
Controls the "human-facing" side of the Agent on the endpoint.
- Show Results Pane: Determines if the end-user can see what the Agent found.
- Context Menu: Enables/disables the right-click "Search with Spirion" option in Windows Explorer.
- User Profiles: Manages how the Agent handles local user profile passwords and logins.
6. Local Reporting & Logging
- Local Scheduling: Enables or prevents users from creating their own scan schedules.
- Logging Types: Detailed configuration of what events (Standard, Location-based, or Discovery) are captured in the local logs.
7. Review and Save
- A final summary page where you can verify all settings before the policy is finalized and staged for delivery to the Agents.
Architectural Note
In version 13.6.1, the "Create Policy" wizard has been updated to support the PostgreSQL-based queueing model for Windows Agents. Settings like Results Storage Mode are particularly important in this version, as they influence how the Agent interacts with its local database to ensure results are safely shipped to the console even during network interruptions.
How to Add a New Policy
To add a new policy use the Create Policy wizard:
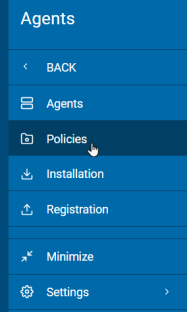
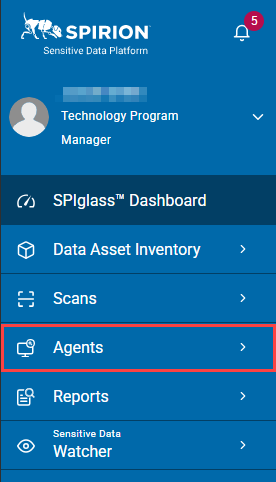
- From the left side navigation menu, click Agents.
- Next, click Policies.
 .
. - In the top right corner of the screen, click the blue + Add Policy button.

- The Create Policy wizard opens.
- On the Policy Setup Basics screen, enter the Policy Name and click the Next button.
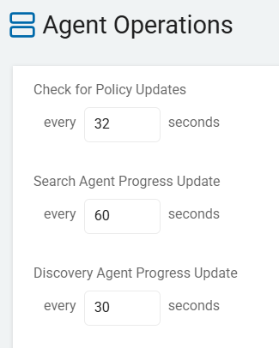
- On the Agent Operations page, set the time interval (in seconds) for the following settings:
- When complete, click Next button to proceed, Previous to return to the previous screen, or the Exit Without Saving button to discard.
- For information about Advanced Options, see the topic "How to Create a New Policy Using the Wizard - Agent Operations - Advanced Options."
Policy Handling in Version 13.6+ Spirion Agents
In Spirion Sensitive Data Platform (SDP) version 13.6+, Agent policy information is stored locally on the endpoint to ensure the Agent can function even if it loses connectivity to the console.
Primary Policy Storage Locations
1. Windows Agent
The policy and configuration files are typically located in the following directory:
- Path:
C:\Program Files (x86)\Spirion\AlpineSetup\Config\ - Key Files:
policy.xml: This is the primary file containing the instructions for the agent (what to scan, what data types to look for, and operational settings).config.dat: A binary file that often contains registration and connectivity information.
2. Mac Agent
For macOS, the settings are stored in a standard XML format within the application support or installation directories:
- Path:
/Library/Application Support/Spirion/(or within the package contents depending on the deployment method). - Key File:
com.identityfinder.macedition.xml(This serves as the local settings file obtained from the console).
New in 13.6+: The PostgreSQL Local Database
Starting with version 13.6, Spirion introduced a local PostgreSQL database on each Agent. While the file policy.xml still defines the "rules," the execution state and queues are now stored in this local PostgreSQL database.
- Location: Found in a sub-folder within the Spirion installation directory (for example,
\PostgreSQL\data). - What's inside:
- Job Queue: A list of specific files or locations the Agent is currently tasked to search.
- Shipper Queue: A list of results that have been found but are waiting to be sent to the Spirion cloud console.
How the Policy is Updated
- Heartbeat: The Agent checks in with the console based on your "Check for Policy Updates" interval.
- Version Check: The Agent compares its local policy version number with the one on the console.
- Download: If the console has a newer version, the Agent downloads the new XML and overwrites the local
policy.xmlfile. - Application: The Agent then reloads its configuration to apply the new settings for the next scan.
Tip: If you are troubleshooting why a policy change isn't taking effect, you can manually inspect the policy.xml file on the endpoint to see if the timestamp and version number match what you expect from the console.
Check for Policy Updates
The “Check for Policy Updates” setting (found on the Agent Operations page of the Create Policy wizard) defines the interval at which the Spirion Agent contacts the console to check if its assigned policy has changed.
- For Agents Version 13.5 and later
What it does
This setting defines the frequency and trigger for the Agent to "check in" with the Spirion Sensitive Data Platform Console to see if any of its assigned policies, search tasks, or global settings have changed.
- Policy Synchronization: It tells the Agent how often to "poll" the console for a new version of its policy.xml or config.dat file.
- Configuration Refresh: If an administrator makes a change to a policy in the console (for example, adding a new file exclusion or changing the log level), the Agent does not receive that change until the next time it checks for updates based on this interval.
- Heartbeat Integration: This check is often tied to the Agent's "heartbeat." When the Agent sends its status to the console, the console responds with information about whether a newer policy version is available for download.
- Set the interval for the Agent to report policy updates to the console:
- Minimum value: 5 seconds
- Maximum value: 86,400 seconds (1,440 minutes, 24 hours)
Key Technical Details
- Default Behavior: If a policy is updated on the console, the Agent compares its local policy version number with the version number provided by the console during the heartbeat. If they differ, the Agent downloads and saves the new policy.xml.
- Location: On the endpoint, the downloaded policy is usually stored in the installation folder (for example, C:\Program Files (x86)\Spirion\AlpineSetup\Config\policy.xml).
Why you would change it
- Responsiveness: If you are actively testing new policy configurations and want Agents to pick up changes quickly, you would set this to a lower value (for example, 5 or 15 minutes).
- Network/Server Load: In very large environments, setting this to a higher value (for example, 1-4 hours) reduces the frequency of requests hitting the console, which helps maintain server stability and reduces network "chatter."
Recommendations
The "correct" value depends entirely on the size of your environment and your current console performance.
Here are the SME-recommended values based on common deployment scales:
1. Small to Medium Environments (< 5,000 Agents)
- Check for Policy Updates: 15 to 30 Minutes
- At this scale, the console can easily handle the "chatter." Keeping the defaults gives you the best "real-time" feel in the UI without any performance penalty.
2. Large Environments (5,000 – 20,000 Agents)
- Check for Policy Updates: 1 Hour
3. Enterprise Environments (20,000+ Agents)
- Check for Policy Updates: 4 to 8 Hours
Tip: If you need an Agent to update its policy immediately without waiting for this timer, you can usually restart the Spirion Agent service on the endpoint, which triggers a check-for-updates upon startup.
Search Agent Progress Update
The “Search Agent Progress Update” setting (found on the Agent Operations page of the Create Policy wizard) is a performance and monitoring configuration that controls the "heartbeat" of a running scan.
- For Agents Version 13.5 and later
What it does
This setting determines how frequently an active Search Agent sends status updates back to the central Spirion Sensitive Data Platform Console while a scan is in progress.
- When a scan is running: The Agent tracks how many files it has searched, how many matches it has found, and its current percentage of completion (for example, "55% done, 12,000 files searched").
- The Update Mechanism: Based on this setting (usually a time interval like every 5, 15, or 30 minutes), the Agent pauses for a millisecond to send these statistics to the Console's Monitoring / Scan History dashboard.
- Set the interval for the Agent to report progress updates to the console:
- Minimum value: 5 seconds
- Maximum value: 86,400 seconds
Why it exists
This setting balances Visibility against Network Overhead:
- Real-Time Monitoring: For a security admin sitting in the Console, this setting provides the "Live View." If you set this to 5 minutes, you can watch a scan progress across 1,000 machines in near real-time.
- Troubleshooting Stalled Scans: If an Agent stops sending progress updates, the Console can flag it as "Stalled" or "Offline." Frequent updates enables an admin to intervene quickly if a scan gets stuck on a massive compressed file or a slow network share.
- Reducing "Chatter" (Bandwidth): In an environment with 100,000 endpoints, having every Agent send an update every 60 seconds would create a "denial of service" attack on the Ingress server. This setting enables you to throttle that traffic.
- Executive Dashboard Accuracy: High-level dashboards that show "Total Matches Found Today" rely on these mid-scan updates to provide accurate data before the end of the business day.
How it works in the architecture
- The Ingress Path: These updates travel from the Agent to the Ingress microservice in the SDP cloud.
- Decoupling: Progress updates are metadata only. They do not include the actual PII results (those are typically buffered and sent in a separate "Result Shipping" workflow).
- Internal Key: This is often associated with the
EmailWatcher\SendSearchProgressorEndpointWatcher\SendSearchProgresssettings in the configuration tree.
Recommendations
The "correct" value depends entirely on the size of your environment and your current console performance.
Here are the SME-recommended values based on common deployment scales:
- Small to Medium Environments (< 5,000 Agents): Set this to 60 Seconds (Default). At this scale, the console can easily handle the "chatter." Keeping the defaults gives you the best "real-time" feel in the UI without any performance penalty.
- For Large-Scale Deployments (10k+ Agents): Set this to 30 minutes or 1 hour. You don't need second-by-second updates for a routine weekly scan, and it saves significant cloud processing costs and network bandwidth.
- For High-Priority Investigations: Set this to 5 minutes. When you are hunting for a specific data leak on a specific server, you want to know exactly where the Agent is in the file system as it happens.
- For "Silent" Background Scans: Set it to a Long Interval. If the user isn't supposed to know the scan is happening, and you aren't in a rush for the data, there is no reason to generate extra network traffic.
Summary
The “Search Agent Progress Update” setting is a Telemetry Throttle. It tells the Agent how often to "call home" with its current percentage and stats, ensuring the administrator has a clear view of the scan's health without overwhelming the network.
Discovery Agent Progress Update
The “Discovery Agent Progress Update” setting (found on the Agent Operations page of the Create Policy wizard) is the specific telemetry control for Discovery Scans.
While it is very similar to the "Search Agent Progress Update," it applies specifically to the Discovery Agent (the worker responsible for mapping out the "Where" rather than the "What").
- For Agents Version 13.5 and later
What it does
This setting defines how often a Discovery Agent—which is tasked with identifying repositories, database instances, or network shares—sends its current status and "percentage complete" back to the SDP Console while it is actively mapping an environment.
- Discovery vs. Search: A Search scan looks inside files for PII. A Discovery scan looks for targets (for example, "Find all SQL servers on this subnet" or "List all folders on this share").
- The Update: As the Discovery Agent crawls a network or a cloud tenant, it increments its progress. This setting tells the Agent to send that progress percentage (for example, "Scanning Subnet 10.1.1.x – 40% complete") to the Console at a fixed interval (for example, every 5, 15, or 60 minutes).
- Set the interval for the Discovery Agent to report progress updates to the console:
- Minimum value: 5 seconds
- Maximum value: 86,400 seconds
Why it exists
- Orchestration Visibility: Discovery scans can take a long time if they are scanning large network ranges. This setting ensures the admin knows the Discovery Agent hasn't crashed or been blocked by a firewall.
- Resource Management: Discovery scans can be intensive as they "ping" various targets. Monitoring the progress helps admins see if a discovery task is taking longer than expected, which might indicate a need to refine the "Discovery Scope" or adjust permissions.
- Inventory Accuracy: Because Discovery is often the first step in a Spirion deployment, getting regular updates enables the admin to see new Targets (like a newly discovered SharePoint site) appearing in the Console even before the full discovery task is finished.
How it works in the architecture
- Target Identification: The Discovery Agent identifies potential "Targets" and "Scans" them for structure.
- Communication: Just like the Search Agent, the Discovery Agent uses a "Pull" model over HTTPS to send its metadata to the SDP Ingress service.
- Internal Key: This is tied to the Discovery-specific worker settings (often
DiscoveryAgent\SendProgressInterval).
Recommendations
The "correct" value depends entirely on the size of your environment and your current console performance.
Here are the recommended values based on common deployment scales:
1. Small to Medium Environments (< 5,000 Agents)
- Discovery Agent Progress Update: 30 Seconds (Default)
- Why: At this scale, the console can easily handle the "chatter." Keeping the defaults gives you the best "real-time" feel in the UI without any performance penalty.
2. Large Environments (5,000 – 20,000 Agents)
- Discovery Agent Progress Update: 60 Seconds
- Why: You want to start "quieting" the Agents. Increasing the Search update to 5 minutes significantly reduces the load on the Kafka pipeline and prevents the console from lagging during large reporting cycles.
3. Enterprise Environments (20,000+ Agents)
- Discovery Agent Progress Update: 120 to 300 Seconds
- Why: At this scale, "Status Updates" are the primary cause of console instability. By moving to a 10-minute heartbeat, you ensure that the console stays responsive for actual search results rather than being choked by "I'm still here" messages.
Summary of the "Golden Rules"
If you want... | Do this... |
|---|---|
Maximum UI Responsiveness | Use the Minimums (60s Search / 30s Discovery). Best for troubleshooting or small labs. |
Maximum Console Stability | Use Higher Values (300s+). Best for large production rollouts to prevent Kafka backlogs. |
Fastest Policy Changes | Set Check for Policy Updates to 5-15 mins. Only do this temporarily during a "tuning" phase. |
Warning: The "Stuck Scan" Illusion
If you set the Search Agent Progress Update to 600 seconds (10 minutes), the progress bar in the console moves only once every 10 minutes.
- The Risk: Your help desk or admins might think the scan is "stuck" and try to cancel/restart it.
- The Fix: If you use high values, make sure your team knows that "no movement" for 9 minutes is expected behavior.
Final Recommendation: If you aren't sure, stick with the Defaults (60s / 30s). Only increase these values if you notice the Console UI becoming sluggish or if you see "Backlog" warnings in your system health dashboard.
Summary
The “Discovery Agent Progress Update” is a Metadata Heartbeat. It ensures the administrator has a live status report on the progress of mapping out the organization's infrastructure, allowing for real-time visibility into the "Inventory" phase of data security.