
How to Create a Policy Using the Wizard - Local Logging Options
After completing the Local Reporting page of the Create Policy wizard, click the Next button to proceed to the Local Logging page to input more detailed options.
Use the following steps to set your local logging options:
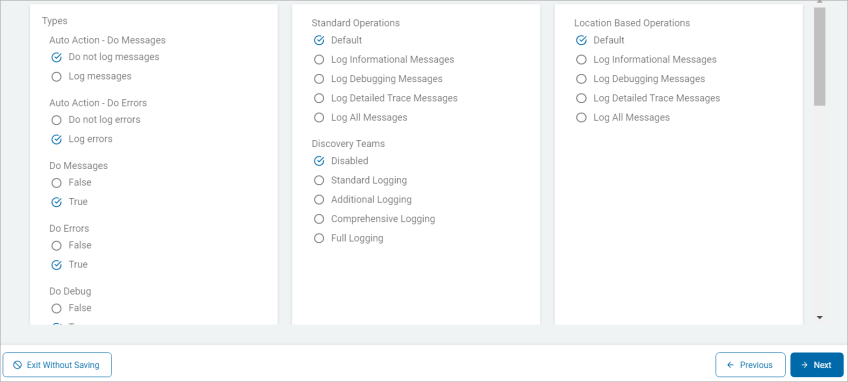
- On the Local Logging screen, you can input logging settings.
- Expand the section for more information:
Local Logging Options
Use the table below to help you fill in the Local Logging screen:
These settings control where and how to log informational and error messages as well as how to create new logs, log user actions, and set log formats. The level of detail to log is configured here.
- Click Advanced Options to input more detailed options.
- For information about Advanced Local Logging Options, see the page the Local Logging - Advanced Options.
Types
Auto Action - Do Messages
The “Auto Action - Do Messages” option (found under the Types section of the Local Logging page in a Policy) is a diagnostic setting that controls whether the Windows Agent records automated remediation events in its local log file.
What it does
When this option is enabled, the Spirion Agent writes a log entry every time an Automatic Action (Playbook or Workflow-driven remediation) is triggered or executed on the endpoint.
- Logging of Automation: It captures the "messages" or status updates generated by the Agent's automation engine.
- Local Record: These entries are stored in the agent's local log file (typically
log.txtorIdentityFinder.logon the Windows host) rather than just being sent to the Cloud Console.
This setting controls logging informational messages when performing auto-actions.
- Do not log messages - A suppression setting that prevents the Windows Agent from recording automated remediation events in its local log file.
- When this option is selected, the Spirion Agent is instructed to silence all log entries related to Automatic Actions (Playbooks or Workflows) on the local host.
- Suppresses Automation Logs: The Agent will not write to the local
log.txtorIdentityFinder.logwhen it performs an automated task like shredding, moving, or classifying a file. - Console-Only Reporting: While the local log remains silent, the Agent will still report the success or failure of these actions back to the SDP Cloud Console. Only the local record on the endpoint is omitted.
- Windows Specific: This setting applies to the Windows Agent, which utilizes the local logging framework for its interactive and background processes.
- Suppresses Automation Logs: The Agent will not write to the local
- Recommendations
- Standard for Production: This is the recommended setting for stable production environments. Once you have verified that your Playbooks are working correctly, there is usually no need to keep a redundant, high-volume log of those actions on every individual endpoint.
- Contrast with Troubleshooting: If you find that a Playbook is failing to remediate files on a specific group of machines, you should temporarily switch this to "Log messages" to gather the diagnostic data needed to identify the cause (for example, "Access Denied" errors).
- Rely on the Console: In modern SDP workflows, the Cloud Console is the primary source of truth for remediation history. Disabling local logging encourages administrators to use the centralized dashboards and reports, which are much easier to audit at scale.
- Log messages - A diagnostic setting that enables the Windows Agent to record detailed information about automated remediation events in its local log file.
- When this option is selected, the Spirion Agent is instructed to write a specific entry to the local host's log file (typically
IdentityFinder.log) every time a Playbook or Workflow triggers an automatic action. - This option is for local logs. It ensures that every automated remediation step taken by the Agent is documented locally on the host, providing the technical detail needed to verify, troubleshoot, and audit the behavior of Spirion's automated data protection rules.
- Captures Automation Activity: It records the "who, what, and where" of automated tasks, such as "Attempting to Shred," "Successfully Quarantined," or "Failed to Classify."
- Detailed Status: These logs often include the specific file path being acted upon and the outcome of the attempt (Success, Failure, or Error).
- This setting is essential for Validation and Forensic Auditing:
- When this option is selected, the Spirion Agent is instructed to write a specific entry to the local host's log file (typically
- Playbook Verification: When you first deploy an automated remediation policy (for example, "Delete any file with more than 50 SSNs"), you need a way to prove the Agent is actually doing it. This setting provides the "receipt" on the local machine.
- Troubleshooting Failures: If the Cloud Console shows that a remediation failed, the local log (enabled via this setting) provides the technical reason why—such as "Access Denied," "File in Use," or "Path Too Long."
- Local Accountability: It creates a local audit trail on the endpoint. If a user asks, "Why did my file disappear?", a technician can check the local log to see that the Spirion Agent deleted it based on a specific security policy.
- How it works in the architecture
- Event Trigger: When a scan finding matches an "Auto Action" rule in the policy, the Agent's remediation module generates an internal status message (for example, "Attempting to Shred file: C:\Data\SSNs.txt").
- Log Filter: The "Local Logging" configuration acts as a filter. If "Auto Action - Do Messages" is checked, the logging service intercepts that internal message and appends it to the local log file on the disk.
- Windows Only: Like most "Local Logging" and "Local Reporting" features, this is specific to the Windows Agent, as it relies on the Windows-specific automation and logging framework.
- Recommendations
- Use During "Pilot" Phases: This should be enabled during the pilot or testing phase of any automation rollout. It is the best way to ensure your logic is sound before applying it to the entire organization.
- Disable for "Business as Usual": Once you are confident in your Playbooks, switch this to "Do not log messages." This prevents the local log files from becoming unnecessarily large, which can happen if the Agent is automatically remediating thousands of files daily.
- Check Permissions: If you see "Log messages" showing consistent failures, it is usually a sign that the Spirion Agent Service (running as LocalSystem or a Service Account) does not have the necessary NTFS permissions to modify or delete the files it is finding.
Auto Action - Do Errors
The “Auto Action - Do Errors” setting (found under the Types section of the Local Logging page in a Policy) is a critical diagnostic control that determines whether the Windows Agent records failures and exceptions encountered during automated remediation in its local log file.
- Do not log errors - Default. a suppression setting that prevents the Windows Agent from recording failed automated remediation attempts in its local log file.
- When this option is selected, the Spirion Agent will not write an entry to the local
IdentityFinder.logfile if a Playbook or Workflow fails to execute an action. - Silences Failure Reports: If the Agent tries to automatically shred a file but fails due to an "Access Denied" error or because the file is "In Use," no record of that failure will be created in the local log.
- Console-Only Error Tracking: The failure will still be reported back to the SDP Cloud Console (visible in the Remediation or Job history), but there will be no technical "footprint" of the error on the endpoint itself.
- This setting is typically used for Log Cleanliness and Resource Management:
- When this option is selected, the Spirion Agent will not write an entry to the local
- Preventing Log Bloat: In environments with significant permission issues or "locked" files, the local log can quickly become filled with repetitive error messages. Selecting this option keeps the local log file small and focused on general system health rather than remediation failures.
- Reducing Disk I/O: On older hardware or high-transaction servers, every write to a log file consumes a small amount of system resources. Disabling error logging for high-volume automated tasks can marginally reduce the Agent's impact on the host.
- Centralized Management Preference: Some organizations prefer that all error analysis happens in the Cloud Console. By disabling local error logging, they ensure that technicians don't waste time looking at local files and instead use the centralized dashboards.
- Primary Use:
- Generally Discouraged: It is not recommended to use "Do not log errors" if you are actively using automated remediation. If a security action (like deleting a sensitive file) fails, you almost always want a local record of why it failed to assist with troubleshooting.
- Use Only in "Noisy" Environments: Only select this if you have a known, unfixable issue that is flooding your logs with errors (e.g., a specific application that constantly locks files) and you have already documented the issue in the Cloud Console.
- Troubleshooting Blind Spot: If you enable this, you lose the ability to perform "on-the-box" diagnostics. If a remediation fails, you will have to rely entirely on the (often less detailed) error message shipped to the console.
- Log errors - A diagnostic setting that instructs the Windows Agent to record any failed automated remediation attempts in its local log file.
- When this option is selected, the Spirion Agent writes a technical entry to the local
IdentityFinder.logfile every time a Playbook or Workflow fails to complete an action. - Captures Technical Failures: If the Agent attempts to automatically shred, quarantine, or redact a file and the operation fails, the Agent logs the event.
- Provides Root Cause Data: The log entry includes the specific reason for the failure, such as:
- Access Denied: The Agent service lacks NTFS permissions.
- File in Use: Another application (like Excel or a system process) has the file locked.
- Path Not Found: The file was moved or deleted between the time it was found and the time the action was attempted.
- Primary Use:
- This setting is the primary diagnostic tool for ensuring that your automated security policies are actually working.
- The "Gold Standard" for Automation: You should always enable "Log errors" if you are using any form of automated remediation. Knowing that an action failed is important, but knowing why it failed is the only way to fix the issue. It is the most common way to identify that the Spirion Agent Service needs higher privileges or that specific folders have restrictive ACLs (Access Control Lists) preventing remediation.
- First Step in Troubleshooting: If the Cloud Console shows a "Remediation Failed" status, your first action should be to retrieve the local log from that machine (either manually or via the "Gather Data" feature) to look for the error messages enabled by this setting.
- It helps security teams identify if other endpoint agents (like Antivirus, EDR, or DLP tools) are interfering with Spirion’s ability to modify or delete sensitive files.
- Check Service Account: If you see a high volume of "Access Denied" errors in the log, it is a clear indicator that the Agent is running as a user with insufficient permissions to manage the data it has discovered.
- Policy Validation: It provides the "proof of failure" needed to justify environmental changes (for example, "We need to change the service account because 20% of our automated shreds are failing with 'Access Denied'").
- When this option is selected, the Spirion Agent writes a technical entry to the local
How it works in the architecture
- Exception Handling: When the Agent's remediation engine encounters an exception during an automated task, it generates an "Error" event.
- Log Filtering: If "Auto Action - Do Errors" is checked, the logging module captures these specific exception events and writes them to the local
IdentityFinder.logfile on the Windows host. - Windows Specific: This is a Windows Agent feature. While Mac and Linux agents report errors to the Cloud Console, they do not use this specific policy-driven local logging configuration.
Recommendations
- Always Enable for Automation: Unlike "Log messages" (which can be noisy), it is highly recommended to always keep "Auto Action - Do Errors" enabled if you are using any automated remediation. You always want to know if a security action failed.
- Monitor for "Access Denied": If you see a high volume of "Access Denied" errors in the log, verify that the Spirion Agent Service is running with the appropriate credentials (usually
LocalSystemor a dedicated Service Account with broad file system access).
Summary
The “Auto Action - Do Errors” option is the "Failure Tracker" for automation. It ensures that every time the Agent is unable to complete a mandated security action, the technical reason for that failure is documented locally, providing the essential data needed to fix permission issues and ensure the success of the organization's data protection goals.
Auto Action - Do User Action
The “Auto Action - Do User Action” setting (found under the Types section of the Local Logging page in a Policy) is a configuration that determines whether the Windows Agent records manual, user-initiated remediation events in its local log file.
Despite the "Auto Action" prefix in the name, this specific setting is focused on the actions taken by a human user interacting with the Agent's results grid.
This setting acts as a toggle for the audit trail of manual remediation. It controls whether the Agent writes a "receipt" to the local IdentityFinder.log when a person clicks a button to handle a finding.
- Do not log user actions - This option prevents the Windows Agent from recording manual remediation steps taken by a user in its local log file.
- When this option is selected, the Spirion Agent does not write an entry to the local
IdentityFinder.logfile when a user manually interacts with scan results to perform an action. - The “Do not log user actions” option is the "Privacy and Cleanliness" setting for local logs. It ensures that manual remediation decisions made by employees remain off the local disk log, keeping the log file concise and respecting user privacy while still allowing for centralized reporting in the SDP Cloud Console.
- Silences Manual Activity: If a user right-clicks a finding and selects Shred, Quarantine, Ignore, or Redact, no record of that specific "User initiated" event is created in the local log on the computer.
- Console Reporting Still Occurs: The action is still reported to the SDP Cloud Console for centralized auditing and reporting. Only the local "paper trail" on the endpoint is suppressed.
- This option is typically used for User Privacy and Log Minimization:
- User Privacy: In some jurisdictions or corporate cultures, logging every specific manual action an employee takes (e.g., which specific files they chose to "Ignore" or "Shred") on their local machine may be considered overly intrusive.
- Reducing Log Volume: On workstations where users perform a high volume of manual remediation, logging every single click can cause the local log file to grow quickly. Disabling this keeps the log focused on system-level errors and automated tasks.
- Centralized Audit Strategy: Many organizations prefer to have a single "Source of Truth" in the Cloud Console. By disabling local logging of user actions, they ensure that all audit inquiries are directed to the centralized reports rather than fragmented local log files.
- When this option is selected, the Spirion Agent does not write an entry to the local
- Recommendations
- Standard for "Silent" or "Automated" Groups: If your users never see the Spirion UI (e.g., you are running silent background scans), this setting is the logical choice because there are no "user actions" to log.
- Use for Privacy Compliance: If your legal or HR department has strict rules about monitoring employee file interactions, selecting "Do not log user actions" helps ensure compliance with those privacy standards.
- Troubleshooting Trade-off: Be aware that if a user claims they "tried to shred a file but it didn't work," you will not have a local log to verify their claim. You will have to rely entirely on the job history in the Cloud Console to see if the action was attempted and why it failed.
- Log user actions - This option records manual remediation steps taken by an end-user within the Windows Agent interface to the local log file.
- The “Log user actions” option is the "Human Audit Trail" for local logs. It ensures that every manual remediation decision made by a user is documented locally, providing accountability and a clear record of human intervention in the data protection process.
- When this option is enabled, the Spirion Agent writes an entry to the local log (typically
IdentityFinder.log) every time a user manually initiates a remediation action from the results grid. - Tracks Manual Remediation: It captures actions like a user right-clicking a finding and selecting Shred, Quarantine, Recycle, or Ignore.
- User Accountability: The log entry documents that a specific action was requested by the user currently interacting with the Agent UI.
- Action Outcome: It records whether the user's manual request was successful or if it encountered an error (e.g., "User initiated Shred on [File Path] - Success").
- This option is used for Auditability and User Behavior Analysis:
- Distinguishing Manual vs. Auto: In environments where both Playbooks (Automatic) and Users (Manual) can remediate data, this setting helps administrators distinguish between what the system did and what the human did.
- Forensic Trail: If a critical file is deleted and a user claims "the software did it automatically," an administrator can check the local log. If "Log user actions" was enabled, the log will show if the deletion was actually a "User initiated" event.
- Troubleshooting User Errors: If a user reports they tried to "Ignore" a file but it didn't work, the log will show the specific technical response to their manual click, helping to identify if there was a UI glitch or a permission issue.
- How it works in the architecture
- Windows Specific: This setting applies to the Windows Agent, as it is the primary platform where users interact with a local results grid to perform manual remediation.
- UI Event Capture: When a user clicks a remediation button in the Windows Agent, the application sends a command to the remediation engine.
- Logging Trigger: If "Log user actions" is checked in the policy, the logging module intercepts this command and writes the details (Action Type, Timestamp, and Target) to the local disk log.
- Event Filtering: When a user performs a manual action in the Windows Agent UI, the application sends a command to the remediation engine.
- Policy Check: The logging service checks the policy configuration. If "Do not log user actions" is active, the service ignores the UI event and does not pass it to the file-writing module that manages the local log on the disk.
Recommendations
- Enable for "Self-Service" Rollouts: If you are asking employees to clean up their own data, enable this setting. It provides the necessary audit trail to prove that users are actually engaging with the tool and taking the requested actions.
- Pair with "Auto Action - Do Messages": To get a complete picture of the machine's health, enable both "Log user actions" and "Log messages" (for auto actions). This gives you a 100% complete history of every change made to sensitive files on that host.
- Privacy Consideration: Be aware that this logs the specific files a user is interacting with. Ensure your internal privacy policy covers the logging of these administrative actions on employee workstations.
Summary
The “Auto Action - Do Action” setting is the "Manual Action Tracker" for local logs. It ensures that every time a human intervenes to remediate sensitive data, that decision is documented locally, providing a clear record of human accountability and a technical trail for troubleshooting manual remediation failures.
Do Messages
The “Do Messages” setting (found under the Types section of the Local Logging page in a Policy) is the primary toggle for recording general operational status and informational events in the Windows Agent's local log file.
What it does
When this setting is enabled, the Spirion Agent writes "Informational" (INFO) level messages to the local log (typically IdentityFinder.log). These messages describe the Agent's routine activities that are not errors or remediation actions.
- Operational Milestones: It logs when a scan starts, when it pauses, when it resumes, and when it completes.
- Policy & Configuration: It records when the Agent successfully checks for a new policy, when it connects to the Cloud Console, and when it loads specific search modules (e.g., "Loading Office search module").
- Search Progress: It can include high-level progress updates, such as which major directories or locations are currently being processed.
Why it exists
This setting is used for Operational Monitoring and Health Checks:
- Verifying Activity: It is the easiest way to confirm that an Agent is actually "doing something." If a scan seems to be taking a long time, an admin can check the local log to see the "Do Messages" entries showing that the Agent is still actively moving through folders.
- Connectivity Troubleshooting: It provides a local record of the Agent's attempts to "heartbeat" or "poll" the Cloud Console, helping to identify if network or proxy issues are preventing policy updates.
- Audit of Scan Scope: It documents exactly when a scan ran and what major areas it targeted, providing a historical record of compliance activity on that specific endpoint.
How it works in the architecture
- Event Stream: The Agent's core engine generates a constant stream of status updates.
- Log Filter: The "Local Logging" policy acts as a gatekeeper. If "Do Messages" is checked, these status updates are formatted and written to the physical log file on the disk (
C:\ProgramData\Spirion\IdentityFinder.log). - Windows Specific: This is a Windows Agent feature. While Mac and Linux agents have their own internal logging, they do not use this specific policy-driven "Local Logging" interface to control informational message verbosity.
Recommendation
- Enable for Initial Deployment: You should always enable this during the first few weeks of a new deployment. It enables you to verify your schedules are firing correctly and that Agents are communicating with the console as expected.
- Disable to Save Disk Space: On servers or endpoints with very limited disk space, you might disable this to keep the log file as small as possible, leaving only "Errors" enabled.
- Use with "Gather Data": If you use the "Gather Data" feature in the SDP Console to pull logs from a remote machine, the "Do Messages" entries are often the most helpful for understanding the "story" of what happened during a specific scan session.
Summary
The “Do Messages” option is the "Activity Tracker" for local logs. It provides the narrative of the Agent's daily operations—showing when scans run, when policies update, and how the Agent is interacting with the system—making it an essential tool for general health monitoring and operational verification.
Do Errors
The “Do Errors” setting (found under the Types section of the Local Logging page in a Policy) is the primary control for recording system-level failures and critical exceptions in the Windows Agent's local log file.
While other settings (like "Auto Action - Do Errors") focus on remediation failures, “Do Errors” focuses on the health and stability of the Agent itself and its ability to perform discovery.
What it does
When this setting is enabled, the Spirion Agent writes an entry to the local log (typically IdentityFinder.log) every time it encounters a technical problem that prevents it from functioning correctly.
- Captures System Failures: It logs critical issues such as the Agent service failing to start, database connection errors (for the local SQLite search history), or crashes in specific search modules.
- Discovery Blockers: It records errors that prevent the Agent from scanning specific locations, such as "Network Path Not Found," "Drive Not Ready," or "Corrupt File" errors that cause a search thread to hang or terminate.
- Communication Errors: It logs failures to connect to the SDP Cloud Console, including SSL/TLS handshake failures, proxy authentication errors, or DNS resolution issues.
Why it exists
This setting is the "First Responder" tool for Agent Health:
- Diagnosing "Silent" Failures: If an Agent appears "Online" in the console but never seems to complete a scan, the "Do Errors" log will reveal if it is hitting a system-level wall (like a memory exception or a permissions block on a root directory).
- Network Troubleshooting: It is the best way to identify why an Agent cannot receive new policies. The log will show the specific socket or HTTP error occurring during the check-in process.
- Stability Monitoring: It helps engineering and support teams identify if a specific file type or system configuration is causing the Agent to become unstable or consume excessive resources.
How it works in the architecture
- Exception Interceptor: The Agent's core framework has a global exception handler. When a "Try/Catch" block in the code catches a failure, it generates an Error event.
- Local Persistence: If "Do Errors" is checked in the policy, the logging module captures that event and appends the technical stack trace or error message to the physical log file on the Windows host.
- Windows Specific: This is a Windows Agent feature. Mac and Linux agents handle system errors through standard OS logs (like
stdoutorsyslog) and do not use this specific policy page.
Recommendations
- Always Keep Enabled: Always set to True. Never disable "Do Errors." It is the most important diagnostic setting in the entire policy. Without it, you are "flying blind" if an Agent stops working or fails to report results.
- The "Gather Data" Essential: When you use the "Gather Data" feature to pull logs for Spirion Support, the entries generated by this setting are the first things the engineers look at to determine the root cause of a ticket.
- Monitor for "Access Denied": If you see "Do Errors" reporting "Access Denied" on the
C:\ProgramData\Spirionfolder, it means the Agent cannot write its own logs or manage its own history, which eventually causes the Agent to stop functioning.
Summary
The “Do Errors” option is the "System Health Monitor" for local logs. It ensures that every technical failure—from network disconnects to system crashes—is documented locally, providing the essential diagnostic data needed to keep the Spirion discovery engine running reliably across the enterprise.
Do Debug
The “Do Debug” setting (found under the Types section of the Local Logging page in a Policy) is the highest level of logging available. It instructs the Windows Agent to record extremely granular, low-level technical details about every internal operation it performs.
What it does
When this setting is enabled, the Spirion Agent switches into "Verbose" mode. It writes a massive amount of data to the local IdentityFinder.log, documenting the "inner thoughts" of the software.
- Step-by-Step Execution: It logs every minor action, such as "Opening file X," "Applying regex Y," "Checking memory buffer Z," and "Closing handle."
- Module Loading: It provides deep details on how specific search modules (like the PDF engine or the Office parser) are interacting with the operating system.
- Raw Communication: It often logs the raw headers or handshake details of the Agent's communication with the SDP Cloud Console.
- Thread Activity: It tracks the start and stop of individual worker threads, which is useful for identifying "hangs" or performance bottlenecks.
Why it exists
This setting is strictly for Advanced Troubleshooting and Engineering Support:
- Identifying "Hangs": If an Agent gets stuck at 99% and never finishes, "Do Debug" will show exactly which file or specific data pattern is causing the engine to loop or stall.
- Bug Isolation: When a suspected product defect is reported, Spirion Engineering will request Debug logs to see the exact sequence of code execution leading up to a crash or an incorrect result.
- Performance Tuning: It helps identify which specific part of a scan is taking the most time (e.g., "Is it the file system crawling or the actual data extraction?").
How it works in the architecture
- Verbose Output: Most software has "hidden" log statements used by developers during creation. Enabling "Do Debug" flips a switch in the Agent that enables these hidden statements to be written to the disk.
- High I/O Impact: Because it writes so much data, it significantly increases Disk I/O and CPU usage compared to standard logging.
- Windows Specific: This is a Windows Agent feature. While Mac and Linux agents have debug modes, they are typically enabled via command-line flags or local config files rather than this specific Policy page.
Recommendations
- Use ONLY for Troubleshooting: Never leave "Do Debug" enabled (True) in a production environment. It causes the log file to grow to gigabytes in size very quickly and can negatively impact the performance of the host machine.
- Short Duration Only: Enable this setting only for a single scan or a specific 24-hour window to capture a specific issue, then immediately switch it back to "Do Messages" or "Do Errors."
- Coordinate with Support: Usually, you should only turn this on if a Spirion Support Engineer specifically asks for "Debug Logs" to help solve a technical ticket.
- Check Disk Space: Before enabling this, ensure the endpoint has several gigabytes of free disk space, as the log file will expand rapidly.
Summary
The “Do Debug” option is the "Microscope" for the Spirion Agent. It provides an overwhelming level of detail intended for developers and support engineers to diagnose the most complex technical failures, performance issues, or software bugs. It is a powerful diagnostic tool that should be used sparingly and only for short-term troubleshooting.
Do Secure Items Skipped
*Windows-agents only.
The “Do Secure Items Skipped” setting (found under the Types section of the Local Logging page in a Policy) is a specialized diagnostic control that instructs the Windows Agent to record instances where it bypassed or skipped files that are protected by encryption or security software.
What it does
When this setting is enabled, the Spirion Agent writes an entry to the local IdentityFinder.log file every time it encounters a file it cannot inspect due to "security-related" barriers.
- Identifies Encrypted Files: It logs files that are password-protected (e.g., encrypted ZIPs, password-protected PDFs, or locked Office documents) which the Agent cannot open without the key.
- Logs Permission Blocks: It records files that were skipped because the Agent encountered a "Security Exception" from the operating system (e.g., a file protected by a specific NTFS security descriptor that explicitly denies the Agent's service account).
- Detects Third-Party Interference: It can capture instances where an external security tool (like an EDR or Antivirus) blocked the Agent from accessing a file for inspection.
Why it exists
This setting is essential for Coverage Auditing and Risk Assessment:
- Identifying "Dark Data": If a file is encrypted, Spirion cannot tell you if it contains SSNs or Credit Card numbers. This setting provides a list of these "blind spots," allowing security teams to follow up and ensure those encrypted files are authorized.
- Verifying Scan Integrity: It helps prove that the Agent tried to scan a location but was prevented by a specific security mechanism, rather than simply ignoring the folder.
- Troubleshooting "Missing" Results: If a user knows a file contains sensitive data but Spirion isn't reporting it, this log will reveal if the file was skipped because it was password-protected.
How it works in the architecture
- Windows Specific: This is a Windows Agent feature. While other agents report skipped items to the console, this specific local logging toggle is part of the Windows policy framework.
- Skipped File Logic: During a scan, if a search module (like the PDF or Archive module) returns a "Security/Encryption" exception, the Agent marks the item as "Skipped."
- Log Entry: If "Do Secure Items Skipped" is checked, the logging module captures the file path and the reason for skipping (e.g., "Encrypted," "Password Protected," or "Access Denied by Security Policy") and writes it to the local disk.
Recommendations
- Enable for Compliance Audits: If you are preparing for a PCI or HIPAA audit, enable this setting. Auditors often ask, "How do you know there isn't sensitive data inside those encrypted ZIP files?" This log provides the list of exactly what needs to be manually verified.
- Monitor for "Password Protected" Trends: If you see a sudden spike in "Secure Items Skipped" logs, it may indicate that employees are starting to use unauthorized encryption tools to hide data from the security team.
- Distinguish from "Do Errors": While "Do Errors" logs system failures, "Do Secure Items Skipped" specifically logs files that were skipped by design because they were protected.
Summary
The “Do Secure Items Skipped” option is the "Blind Spot Detector" for local logs. It ensures that every file the Agent couldn't scan due to encryption or security restrictions is documented, providing a clear map of where sensitive data might be "hiding" behind passwords or protected containers.
Enable Logging
The “Enable Logging” setting (found at the top of the Local Logging page in a Policy) is the master "On/Off" switch for the Windows Agent's local logging system.
What it does
This setting determines whether the Spirion Agent is enabled to write any data to a physical log file on the local machine's disk.
- The Gateway Setting: If disabled, the Agent does not create or update a local log file, regardless of what other boxes (like "Do Errors" or "Do Messages") are checked.
- Activates the Sub-Settings: When this setting is enabled, it "unlocks" the logging engine, enabling it to process the specific types of data you have selected in the "Types" section (Errors, Messages, Debug, etc.).
- File Creation: When enabled, the Agent typically creates or appends to the
IdentityFinder.logfile located in theC:\ProgramData\Spiriondirectory.
Why it exists
This setting provides Global Control over the Agent's local footprint:
- Resource Conservation: On extremely high-performance servers or machines with critically low disk space, an administrator can use this to ensure the Agent never writes to the disk, eliminating any potential Disk I/O impact.
- Security & Privacy: In highly sensitive environments where local logs themselves might be considered a security risk (as they contain file paths and metadata): this enables a "Zero Local Footprint" policy.
- Centralization Strategy: Some organizations prefer that agents only report to the Cloud Console. By disabling local logging, they force all troubleshooting and auditing to happen through the centralized SDP interface.
How it works in the architecture
- Windows Specific: This master toggle controls the Windows Agent's local logging framework.
- The Kill Switch: The Agent's logging module checks this policy setting first. If it is set to "Disabled," the module immediately discards all log events generated by the engine before they ever reach the file-writing service.
- Persistence: This setting is delivered via the Policy. Once an Agent receives a policy with logging disabled, it will stop writing to its local log immediately.
Recommendations
- Always Enable by Default: For nearly all deployments, "Enable Logging" should be enabled. Without local logs, troubleshooting a "broken" agent becomes significantly more difficult, as you lose the ability to see what is happening "on the box."
- The "First Step" in Troubleshooting: If you are looking for a log file on a machine and it doesn't exist, in the SDP Console check whether the "Enable Logging" box is checked in the policy assigned to that machine (endpoint).
- Pair with "Do Errors": At a minimum, enable both "Enable Logging" and "Do Errors" (set to "True"). This ensures the Agent stays silent during normal operation but leaves a "black box" record if it crashes or fails.
Summary
The “Enable Logging” option is the "Master Power Switch" for the local log. It is the foundational setting that must be active for any local diagnostic, audit, or troubleshooting data to be saved to the endpoint's disk.
Retention
The “Retention” setting (found under the Types section of the Local Logging page in a Policy) is a maintenance control that determines how long the Windows Agent keeps its local log data before it is automatically deleted or overwritten.
What it does
This setting defines the lifespan of the local log file (IdentityFinder.log) on the endpoint's disk. It enables administrators to set a specific threshold—typically measured in days—after which the Agent purges old log entries.
- New log every search - This option is a log-rotation setting that instructs the Windows Agent to start a fresh log file for every individual scan task.
- When this option is selected, the Spirion Agent changes how it handles the local
IdentityFinder.logfile: - Clears Previous Data: At the exact moment a new search begins, the Agent wipes the existing content of the local log file (or archives it and starts a new one) so that the log only contains data for the current execution.
- Isolation of Results: It ensures that the log file on the disk is a "clean slate" containing only the errors, messages, and actions associated with the most recent scan.
- Prevents File Growth: Because the log is reset at the start of every search, the file size remains very small and never accumulates weeks or months of historical data.
- Rolling Log Behavior: In practice, this creates a "rolling" log where you always have the most recent $X$ days of activity available for troubleshooting, while older, irrelevant data is discarded.
- When this option is selected, the Spirion Agent changes how it handles the local
- Append to previous log - This option is a log-persistence setting that instructs the Windows Agent to add new entries to the end of the existing log file rather than clearing it.
- When this option is selected, the Spirion Agent maintains a continuous, chronological record of its activity in the local
IdentityFinder.logfile: - Preserves History: When a new scan starts, the Agent opens the existing log file and begins writing new data at the bottom. It does not delete the information from yesterday's scan or the previous week's check-in.
- Continuous Narrative: It creates a single, ongoing "story" of the Agent's health, showing multiple scan cycles, policy updates, and heartbeats in one place.
- Works with "Days" Retention: This is the default behavior when you want to use the "Retention (Days)" setting. The Agent appends new data daily and only prunes the oldest entries once they exceed your specified day limit.
- When this option is selected, the Spirion Agent maintains a continuous, chronological record of its activity in the local
Why it exists
This setting is critical for Endpoint Stability and Compliance:
- Preventing "Disk Full" Errors: Without a retention policy, a Spirion Agent running frequent scans (especially with "Do Messages" or "Do Debug" enabled) could eventually fill up a workstation's hard drive with text logs.
- Compliance with Data Privacy Laws: Some regulations (like GDPR) require that technical logs containing potentially sensitive metadata (like file paths) are not kept longer than necessary. This setting automates that compliance.
- Troubleshooting Efficiency: By limiting the log to a reasonable window (for example, 30 days), administrators don't have to sift through years of irrelevant data when trying to diagnose a recent scan failure.
How it works in the architecture
- Maintenance Task: The Windows Agent performs a maintenance check (usually at the start or end of a scan task). It inspects the timestamps of the entries in the local log file.
- Pruning: Any data older than the "Retention" value defined in the policy is truncated from the file.
- Windows Specific: This is a Windows Agent policy setting. Mac and Linux Agents typically rely on the operating system's native log rotation utilities (like
logrotate) rather than a policy-driven retention field in the Spirion console.
Recommendations
- Standard Recommendation (30 Days): For most organizations, a 30-day retention period is the "sweet spot." it provides enough history to troubleshoot issues from the previous month without significantly impacting disk space.
- Shorten for Debugging: If you have enabled "Do Debug" for a specific troubleshooting session, consider lowering the retention to 7 days or less to mitigate the massive amount of data being written.
- Extend for High-Security Servers: On critical servers where you need a long-term audit trail of who shredded what, you might extend this to 90 days, provided the server has ample disk space.
Summary
The “Retention” setting is the "Self-Cleaning" mechanism for local logs. It balances the need for historical diagnostic data with the practical reality of limited endpoint disk space, ensuring the Spirion Agent remains a "good citizen" on the host operating system.
Do Locations Searched
*Windows-agents only.
The “Do locations searched” setting (found under the Types section of the Local Logging page in a Policy) is a high-verbosity audit setting that instructs the Windows Agent to record every single file, folder, or object it inspects, regardless of whether that item contains sensitive data.
What it does
When this setting is enabled (set to "True"), the Spirion Agent writes an entry to the local IdentityFinder.log for every item it touches during a scan.
- Full Path Logging: It records the full file path (e.g.,
C:\Users\JGreen\Documents\Project_Notes.docx) for every file the Agent opens and scans. - Proof of Inspection: It creates a definitive record that the Agent successfully accessed and processed a specific location.
- Massive Log Volume: Because it logs everything (even empty text files or non-sensitive images), it generates a significantly larger volume of log data than any other setting except "Do Debug."
Why it exists
This setting is used for Verification of Coverage and Forensic Auditing:
- Proving a "Negative": If a stakeholder asks, "Are you sure you scanned the 'Finance' folder?", this setting provides the line-by-line proof in the local log showing that every file in that folder was indeed inspected.
- Identifying Permission Gaps: If you suspect the Agent is skipping certain files but not reporting them as "Errors," you can check this log. If a file path is missing from the "Locations Searched" list, you know the Agent never even reached it.
- Performance Bottleneck Identification: By looking at the timestamps between "Locations Searched" entries, an administrator can see exactly which large files or complex directories are slowing down the scan.
How it works in the architecture
- Windows Specific: This is a Windows Agent feature. It is primarily used when scanning local drives or attached network shares where file-level auditing is required.
- The "Touch" Trigger: Every time a search worker thread successfully opens a file handle and passes the content to a search module, it sends a "Location Searched" event to the logging service.
- Local Disk Impact: Because a standard workstation can have hundreds of thousands of files, enabling this setting can cause the local log file to grow by hundreds of megabytes in a single scan.
Recommendation
archTIS recommends disabling this setting (set to "False"), by default.
- Use for "Spot Checks" Only: Do not leave this setting enabled in a standard production policy. The sheer volume of data quickly fills up disk space and makes the log file difficult to open in standard text editors like Notepad.
- The "Missing File" Diagnostic: If you are troubleshooting why a specific file isn't showing up in your results, enable this setting for one scan. If the file appears in the log as "Searched" but has no matches, you know your Data Definition (SDD) is the problem. If the file doesn't appear in the log, you know your Scan Scope or Permissions are the problem.
- Disable for Performance Benefit: If an endpoint is experiencing high CPU or Disk I/O during a scan, disabling "Do locations searched" is often the first step to reducing the Agent's overhead.
Summary
The “Do locations searched” option is the "Total Audit" setting. It provides a complete, item-by-item manifest of the Agent's journey through the file system. While it is an invaluable tool for proving 100% scan coverage, its high impact on log size means it should be reserved for short-term verification and deep troubleshooting.
Do Matching Locations
The “Do matching locations” setting (found under the Types section of the Local Logging page in a Policy) is a targeted audit setting that instructs the Windows Agent to record the file paths or locations where sensitive data was actually found.
What it does
When this setting is enabled, the Spirion Agent writes an entry to the local IdentityFinder.log only when a search results in a "hit."
- Records the "Hits": It logs the full path of any file, email, or database row that contains data matching your enabled Data Types (for example,
C:\Users\JGreen\Desktop\Tax_Return_2023.pdf). - Summary of Findings: It provides a local "manifest" of sensitive data locations on that specific machine.
- Excludes Non-Matches: Unlike "Do locations searched," this setting ignores the thousands of "clean" files the Agent inspects, keeping the log file much smaller and more focused.
Why it exists
This setting is used for Local Accountability and Quick Verification:
- Local "Receipt" of Risk: It provides a local record of why a machine is considered "at risk." If a security officer is physically at a user's desk, they can check the local log to see exactly which files triggered a red flag in the console without needing to log into the SDP web interface.
- Remediation Context: If a user is performing manual remediation, this log serves as their "to-do list." They can see exactly which files they need to shred or move based on the Agent's most recent findings.
- Forensic Trail: If a file is later deleted or moved, the "Do matching locations" log provides historical proof that the file did exist at that location and did contain sensitive data at the time of the scan.
How it works in the architecture
- Match Trigger: When a search worker thread identifies a sensitive data match (for example, a Social Security Number), it generates a "Match" event.
- Logging Filter: The logging service checks the policy. If "Do matching locations" is enabled, it captures the location metadata from that event and appends it to the local log file.
- Privacy Note: Importantly, this setting typically logs the location (the path), but it does not log the actual sensitive values (the "matches" themselves) to the local log, preserving the security of the data.
Recommendation
- Enable for "Discovery" Phases: This is a "Best Practice" setting for the initial discovery phase of a project. It gives you a clear, readable list of findings on the endpoint without the overwhelming noise of a full "Locations Searched" log.
- Low Performance Impact: Because matches are usually a small fraction of the total files searched, this setting has a very low impact on CPU and Disk I/O. It is safe to leave enabled in most production environments.
- Use for User Education: If you are training employees to manage their own data, showing them the "Do matching locations" log on their own machine is a powerful way to demonstrate exactly where they are storing risky information.
Summary
The “Do matching locations” option is the "Findings Tracker" for local logs. It filters out the noise of the search process and records only the "hits," providing a concise and actionable local record of exactly where sensitive data resides on the endpoint.
Do User Actions
The “Do user actions” setting (found under the Types section of the Local Logging page in a Policy) is an audit control that instructs the Windows Agent to record any manual intervention or command initiated by a person through the Agent's local user interface.
What it does
When this setting is enabled, the Spirion Agent writes an entry to the local IdentityFinder.log whenever a user interacts with the software on their machine.
- Manual Scan Controls: It logs when a user manually clicks "Start," "Pause," "Resume," or "Stop" on a scan from the local Agent window.
- Interactive Remediation: It records when a user manually selects a result and chooses an action like Shred, Quarantine, Redact, or Ignore.
- Configuration Changes: It logs if a user attempts to modify local settings, enter a password to unlock the interface, or manually check for policy updates.
- Application Launches: It records when the Spirion GUI (the interactive "Main Interface") is opened or closed by the logged-in user.
Why it exists
This setting is used for Accountability and User Behavior Monitoring:
- Audit Trail for Remediation: If a critical file is shredded, the "Do user actions" log provides the proof of who did it and when. It distinguishes between an automated "Playbook" action and a manual "User" action.
- Troubleshooting "Stopped" Scans: If a scheduled scan consistently fails to finish, this log can reveal if the end-user is manually stopping or pausing the scan because they find it intrusive.
- Verifying Policy Compliance: It helps administrators see if users are actually engaging with the tool (e.g., "Is the user opening the interface to review their findings as instructed?").
How it works in the architecture
- UI Event Listener: The Agent's interactive component (the GUI) has an event listener. When a button is clicked or a menu item is selected, it sends a "User Action" event to the core logging service.
- Local Attribution: The log entry typically includes the action taken and the context (e.g., "User initiated Shred on file X").
- Windows Specific: This is a Windows Agent feature. It is specifically relevant to the "Interactive" or "User" mode of the Windows Agent where a GUI is available to the end-user.
Recommendations
- Enable for "Self-Service" Programs: If your data protection strategy relies on users cleaning up their own data (the "User-Driven Remediation" model), always enable this. It is your only local evidence of user participation.
- Monitor for "Scan Avoidance": If you see frequent "User stopped search" entries in the log, it’s a signal that the scan might be too resource-intensive or scheduled at an inconvenient time, allowing you to adjust the policy to be less disruptive.
- Forensic Value: In the event of a "wrongful deletion" claim by an employee, this log is the primary piece of evidence used to determine if the user manually authorized the deletion of the file.
Summary
The “Do user actions” option is the "Activity Auditor" for the local interface. It ensures that every manual click and remediation decision made by a human is documented, providing a clear record of how employees are interacting with the Spirion Agent and their sensitive data findings.
Log Format
The “Log format” setting (found under the Types section of the Local Logging page in a Policy) determines the structural layout and encoding of the data written to the local IdentityFinder.log file.
This setting enables you to choose how the log information is organized, making it easier for either humans or automated systems to read.
Available Options
- Fixed width - A specific structural configuration for the plain-text log file. Instructs the Windows Agent to write every log entry using a strictly defined number of characters for each column (Timestamp, Log Level, and Message), ensuring that the data aligns vertically.
- This setting is a legacy-friendly option designed for Legacy Log Parsers and Human Readability:
- Ease of Visual Scanning: For a human administrator, a fixed-width log is much easier to "skim." You can look straight down the "Log Level" column to find "ERROR" without your eyes jumping left and right because of varying timestamp lengths.
- Legacy System Integration: Some older log-monitoring tools or mainframe-style ingestion engines cannot handle "delimited" data (like CSV or Tab-separated) easily. They prefer "positional" data where they are told: "The Status is always found between characters 20 and 30."
- Command-Line Friendliness: If you are viewing logs via a command-line tool (like
typeorPowerShell), fixed-width formatting prevents the text from looking "jumbled" on the screen.
- Monospaced Dependency: This format only "looks" correct if viewed in a monospaced font. In a proportional font (like Arial), the columns will still appear slightly crooked because different characters have different widths.
- Use for Manual Log Review: If you find yourself manually opening
IdentityFinder.logfrequently to troubleshoot, Fixed width is often the most comfortable format for the human eye. - Avoid for Modern SIEMs: If you are sending logs to a modern tool like Splunk or ELK, "Fixed width" is less efficient than standard delimited text or XML, as the extra padding spaces unnecessarily increase the file size.
- Check your Editor: If the columns look messy even with this setting enabled, ensure your text editor (like Notepad or Notepad++) is set to a monospaced font.
- When "Fixed width" is selected, the Agent does not just separate data with spaces or tabs; it reserves a specific "block" of space for each piece of information:
- Vertical Alignment: If you open the log in a text editor (using a monospaced font like Courier or Consolas), the columns are perfectly straight. The "Log Level" (for example, INFO, ERROR) always starts at the exact same character position on every line.
- Padding: If a piece of data is shorter than the reserved space (for example, the word "INFO" in a 10-character column), the Agent adds "padding" spaces to fill the gap before starting the next column.
- Predictable Parsing: Because the data always starts at the same character index (for example, the Message always starts at character 35), it enables very simple scripts to extract data without needing complex logic.
- Comma-separated - Instructs the Windows Agent to write the local log file using CSV (Comma-Separated Values) structure.
- This is the "Data Analyst" setting. It transforms the local log from a simple text file into a structured database-ready format, making it the ideal choice for administrators who need to perform deep-dive analysis, filtering, and reporting on agent activity.
- When this option is selected, the Agent organizes each log entry into a single line where each distinct piece of information (metadata) is separated by a comma.
- Standard CSV Structure: A typical entry resembles the following:
2024-05-20 10:15:01, ERROR, SearchModule, Access Denied, C:\Data\Secret.docx - Delimited Fields: It treats the Timestamp, Log Level, Component, and Message as individual "fields" or "columns."
- Spreadsheet Ready: Because it follows the universal CSV standard, the resulting
IdentityFinder.logfile can be opened directly in Microsoft Excel or Google Sheets, where it is automatically parsed into a clean, sortable table.
- Standard CSV Structure: A typical entry resembles the following:
- This setting is designed for Data Analysis and Portability:
- Easy Filtering and Sorting: By opening the log in Excel, an administrator can quickly filter for only "ERROR" rows, sort by "Timestamp" to find the exact moment a crash occurred, or search for specific file paths across thousands of entries.
- Universal Compatibility: Almost every data tool in existence—from SIEMs (Splunk, Sentinel) to database import wizards—can natively read and "understand" a comma-separated file without needing a custom plugin.
- Scripting Simplicity: For IT teams writing their own PowerShell or Python scripts to monitor agents, a comma-separated format is much easier to "split" and process than a fixed-width or unstructured text file.
- Tab-separated - Instructs the Windows Agent to write the local log file using a TSV (Tab-Separated Values) structure.
- The “Tab separated” option is the "Robust Structure" setting. It provides all the analytical power of a spreadsheet-ready format while avoiding the common data-parsing errors associated with commas in file paths, making it one of the most reliable formats for both human review and automated processing.
- When this option is selected, the Agent organizes each log entry into a single line where each piece of metadata (Timestamp, Log Level, Message, etc.) is separated by a Tab character (
\t) rather than a comma or a space. - TSV Structure: A typical entry will look like this:
2024-05-20 10:15:01 ERROR SearchModule Access Denied - Clean Visual Separation: Because tabs are wider than spaces, the data appears naturally aligned in columns even in simple text editors, without the rigid character-counting of "Fixed width."
- Spreadsheet Compatibility: Like CSV, tab-separated files are natively recognized by Microsoft Excel. If you copy a line from a tab-separated log and paste it into Excel, it will automatically snap into the correct columns.
- TSV Structure: A typical entry will look like this:
- This setting is often preferred over "Comma separated" for Handling Complex File Paths:
- Avoiding "Comma Conflicts": In many environments, file names or folder paths contain commas (for example,
C:\Reports\Finance, Q3.docx). In a Comma separated log, that extra comma can "break" the columns. Since file paths almost never contain a Tab character, Tab separated is a much safer way to ensure the log remains structured and readable. - Superior for Copy-Paste: If an administrator needs to copy a specific error or a list of "Matching Locations" from the log into a report, ticket, or spreadsheet, the tab-delimited format preserves the column structure perfectly during the paste.
- Developer Preference: Many system administrators and developers prefer TSV for log parsing because it is easier to write "regex" or "split" commands for tabs than it is for commas (which require complex logic to ignore commas inside quotes).
- Avoiding "Comma Conflicts": In many environments, file names or folder paths contain commas (for example,
Why this setting exists
The "Log format" setting is about Interoperability:
- Tool Compatibility: Different Security Information and Event Management (SIEM) tools have different preferences. This setting ensures Spirion can "speak the language" of your existing security stack.
- Parsing Accuracy: In Plain Text, a file path containing a comma or a bracket might confuse a script. In a structured format like XML, the tags clearly define where the file path starts and ends, preventing data errors.
- Standardization: It enables an organization to enforce a consistent log structure across thousands of endpoints, making global log analysis possible.
How it works in the architecture
- The Formatter Module: When the Agent generates a log event (like an Error or a Match), it passes that data to a "Formatter." The Formatter looks at this policy setting and wraps the raw data in the appropriate "skin" (Text or XML) before sending it to the disk-writing service.
- Windows Specific: This setting primarily controls the output of the Windows Agent's local logging engine.
Recommendations
- Fixed width:
- Use for Manual Log Review: If you find yourself manually opening
IdentityFinder.logfrequently to troubleshoot, Fixed width is often the most comfortable format for the human eye. - Avoid for Modern SIEMs: If you are sending logs to a modern tool like Splunk or ELK, "Fixed width" is less efficient than standard delimited text or XML, as the extra padding spaces unnecessarily increase the file size.
- Check your Editor: If the columns look messy even with this setting enabled, ensure your text editor (like Notepad or Notepad++) is set to a monospaced font.
- Use for Manual Log Review: If you find yourself manually opening
- Comma Separated:
- Best for Large-Scale Troubleshooting: If you are dealing with a log that is thousands of lines long, Comma separated is the best choice. Trying to find a specific error in a massive plain-text file is difficult; doing it in a filtered Excel table is easy.
- The "SIEM Lite" Approach: If you don't have a centralized log aggregator but still want to perform "big data" analysis on your agent health, use this format to collect logs from several machines and merge them into one master spreadsheet.
- Watch for "Comma Bloat": If your file paths are extremely long and complex, a CSV log can sometimes become hard to read in a standard text editor. It is truly meant to be viewed in a spreadsheet tool.
- Tab Separated:
- The "Safest" Structured Format: If you want a structured log that you can open in Excel, Tab separated is generally superior to Comma separated for Spirion. Because Spirion logs deal heavily with file paths, using tabs eliminates the risk of "column shifting" caused by commas in filenames.
- Use for Reporting: If you are building a manual report of "Matching Locations" to send to a department head, use this format. You can quickly open the log, copy the data, and paste it into a clean table in Word or Excel.
- Visual Troubleshooting: If you find "Fixed width" too cramped but "Plain text" too messy, "Tab separated" provides a nice middle ground that is very easy on the eyes
Summary
The “Log format” setting is the "Language Selector" for the log file. It enables you to choose between a human-friendly text format for quick troubleshooting or a machine-friendly structured format for automated security monitoring and log aggregation.
Log Types
Error
A filtering control that determines which events are sent from the local Agent to the central SDP Console for visibility.
When "Error" is selected, the Agent only transmits the most critical failure messages to the Console's "Logs" or "Status" views.
- Filters for Failures: It suppresses all routine "INFO" messages (like "Search Started" or "Policy Updated") and only reports events where something went wrong.
- Console-Specific: This setting specifically controls what is uploaded to the SaaS Console. It does not necessarily change what is written to the local
IdentityFinder.logfile on the endpoint's disk (which is controlled by the "Types" section). - Minimalist Reporting: It ensures that the Console only alerts you to machines that require immediate attention due to a functional failure.
What is considered an "Error"?
In the Spirion ecosystem, an "Error" typically includes:
- Access Denied: The Agent could not scan a specific location due to insufficient permissions.
- Network Failures: The Agent could not reach a remote target (like a file share or database).
- Service Crashes: A component of the Agent (like the Search Worker) failed to initialize or crashed during execution.
- License Issues: The Agent's license has expired or is invalid.
Why it exists
This setting is designed for Noise Reduction and Scalability:
- Focus on Actionable Data: In an environment with 10,000 agents, you do not want the Console flooded with millions of "Search Started" messages. By selecting "Error," you ensure that when you look at the Console, you only see things that you actually need to fix.
- Bandwidth Conservation: Transmitting logs from thousands of endpoints to the cloud consumes network bandwidth. Limiting the upload to only "Errors" significantly reduces the data footprint of the Spirion platform.
- Database Efficiency: It prevents the SDP backend database from becoming bloated with routine operational data, keeping the Console interface fast and responsive.
How it works in the architecture
- The Ingress Filter: The Agent's "Shipper" process looks at the event it just recorded. If the event is tagged as an "Error," it is added to the queue to be sent to the Ingress server. If it is tagged as "Info" or "Warning," it is ignored for the purposes of Console reporting.
- Windows Agent Behavior: This is a core part of the Windows Agent's communication policy with the SDP Cloud.
Recommendations
- The "Production Standard": For 99% of production environments, "Error" is the recommended setting. It provides the perfect balance of visibility into problems without overwhelming the administrator with useless data.
- Contrast with "Warning": If you find that you are missing important context (like "Search completed with skipped files"), you might consider moving up to the "Warning" level.
- Don't use for Debugging: If you are actively troubleshooting a specific machine, do not rely on the Console logs. Instead, look at the local
IdentityFinder.logon that machine, which should be set to a higher verbosity (like "Do Messages" or "Do Debug").
Summary
The “Error” option is the "Critical Alerts Only" setting for the Console. It ensures that your central management interface remains a clean, actionable dashboard focused on resolving failures rather than monitoring routine background tasks.
Information
A high-visibility reporting level that instructs the Agent to send nearly all operational events to the central SDP Console.
What it does
When "Information" is selected, the Agent transmits a comprehensive stream of activity data to the Console, providing a detailed "play-by-line" of what the Agent is doing in the field.
- Reports Routine Success: Unlike the "Error" setting, this level includes successful milestones such as "Search Started," "Search Completed," "Policy Applied," and "Agent Heartbeat."
- Full Operational Context: It sends Errors, Warnings, and Info-level messages. If a scan runs perfectly, you will see the start and end times in the Console logs.
- Console-Specific: This setting controls the data uploaded to the SaaS/Cloud Console. It is independent of the local logging verbosity on the endpoint's disk.
What is included in "Information"?
In addition to failures, "Information" logs typically include:
- Search Lifecycle: Exact timestamps for when a scan began and when it finished.
- Policy Updates: Confirmation that the Agent successfully received and implemented a new policy from the Console.
- Remediation Events: Records of automated actions taken (for example, "File successfully shredded by Playbook").
- Connectivity Events: Confirmation that the Agent successfully checked in or synchronized with the platform.
Why it exists
This setting is used for Verification, Auditing, and Small-Scale Monitoring:
- Proof of Activity: If an auditor asks, "Can you prove the scan actually ran on these 50 machines yesterday?", the "Information" level provides the "Search Started/Completed" logs in the Console as definitive proof.
- Deployment Monitoring: When first rolling out Spirion to a new department, administrators use this setting to watch the "live" progress of the agents to ensure they are checking in and executing tasks as expected.
- Troubleshooting Workflow: It helps identify where a process is hanging. If a scan never reaches "Completed," the "Information" log shows you exactly when it "Started," helping you narrow down the timeframe of the issue.
How it works in the architecture
- The Shipper Queue: Every time the Agent performs a standard action, it generates an "Info" event. With this setting enabled, the Shipper process adds these events to its queue and sends them to the Ingress server for display in the Console.
- Increased Data Volume: This setting generates significantly more traffic and database entries than the "Error" or "Warning" settings.
Recommendations
- Use for "Pilot" Groups: Enable "Information" for a small group of test machines (5–10) during a pilot. It gives you the visibility needed to fine-tune your policies.
- Avoid for Large Global Policies: Do not enable this for thousands of agents simultaneously. The sheer volume of "Search Started" and "Search Completed" messages can make the Console logs difficult to navigate and can put unnecessary load on the reporting database.
- The "Audit" Toggle: If you have a compliance requirement to show a history of successful scans in the central Console, you may need this setting, but be prepared to manage the increased log volume.
Summary
The “Information” option is the "Full Transparency" setting for the Console. It moves beyond just reporting failures and provides a complete record of the Agent's successful operations, making it the ideal choice for auditing, pilot programs, and verifying that your data protection policies are being actively executed.
Debug
This is a specific reporting toggle that controls whether the summary of a scan's findings is transmitted to the Console's logging view.
What it does
When "Search Result" is enabled, the Agent sends a high-level summary event to the Console once a scan completes.
- Summary, Not Details: This does not send the individual sensitive data "Matches" (the specific files found) to the Results grid—that is handled by a separate result-shipping process. Instead, this setting sends a log entry that summarizes the outcome of the search.
- Key Metadata: The log entry typically includes the following:
- Total number of files searched
- Total number of matches found
- Total duration of the scan
- The completion status (for example, "Completed successfully" or "Completed with errors")
- Console Visibility: These summaries appear in the Logs section of the Console, providing a chronological history of scan performance for that specific endpoint.
Why it exists
This setting is used for Performance Tracking and High-Level Auditing:
- Quick Health Check: It enables an administrator to look at the Console logs and quickly see, "The scan on Finance-PC-01 took 4 hours and searched 1 million files," without having to dig into the detailed "Results" or "Findings" tabs.
- Trend Analysis: By having these summaries in the log history, you can identify if scans are suddenly taking much longer or finding significantly more data than usual, which could indicate a change in user behavior or a configuration issue.
- Verification of Completion: It serves as a "receipt" for the scan. Even if no sensitive data was found (0 matches), the "Search Result" log entry proves that the scan actually ran to completion and inspected the expected number of files.
How it works in the architecture
- Post-Scan Trigger: Once the Search Worker finishes its task and the results are compiled, the Agent generates a "Search Summary" event.
- Shipper Process: If "Search Result" is selected in the policy, the Shipper picks up this summary event and sends it to the Ingress server.
- Separation of Concerns: It is important to distinguish this from the Result Shipping architecture. Result Shipping sends the actual "hits" to the database for remediation; the "Search Result" log type simply sends a "status report" about the scan itself to the log history.
Recommendations
- Highly Recommended for Production: You should almost always have this enabled. It is the most efficient way to verify that your agents are actually working and to monitor the "speed" of your scans across the enterprise.
- Use for Troubleshooting "Slow Scans": If a user complains that Spirion is slowing down their computer, check the "Search Result" logs in the Console. If you see the "Files Searched" count is in the millions, you know you need to refine your Scan Locations to be more targeted.
- Audit Trail: This is often the primary log used during compliance audits to demonstrate that "100% of targeted endpoints completed a scan within the last 30 days."
Summary
The “Search Result” option is the "Scan Receipt" setting. It provides a concise, high-level summary of every completed search in the Console logs enabling administrators to track scan performance, verify coverage, and maintain a historical record of Agent activity without reviewing individual data matches.
Search Result
This is a reporting toggle that controls whether a high-level summary of a completed scan is sent to the Console's log history.
What it does
When "Search Result" is enabled, the Agent generates a single, concise "Status Report" event at the very end of a scan and transmits it to the central Console.
- The "Scan Receipt": It acts as a summary of the work performed. It does not contain the individual files found (those are sent via the Result Shipping process to the Findings grid); instead, it provides the "stats" of the job.
- Key Information Included:
- Total Files Searched: How many items the Agent actually inspected.
- Total Matches Found: The total count of sensitive data hits.
- Duration: How long the scan took to complete (Start/End times).
- Status: Whether the scan finished successfully, was canceled, or completed with errors.
- Console Visibility: These summaries appear in the Logs tab of the Console, providing a chronological audit trail of every scan performed by that Agent.
Why it exists
This setting is essential for Operational Oversight and Compliance:
- Verification of Coverage: It provides definitive proof that a scan occurred. If an auditor asks, "Did you scan the HR Server this month?", the "Search Result" log entry is your "receipt" showing exactly when it ran and how much data it covered.
- Performance Monitoring: It enables administrators to spot trends. If a scan that usually takes 2 hours suddenly takes 12 hours, the "Search Result" log will show the increase in "Files Searched," helping you identify if a massive new data set was added to the server.
- Health Check: It is the easiest way to see if agents are "finishing" their work. If you see "Search Started" logs but never see a "Search Result" log, you know the agent is hanging or crashing before completion.
How it works in the architecture
- Post-Scan Trigger: Once the Search Worker process finishes its final task, it compiles the totals and triggers the "Search Result" event.
- Shipper Transmission: The Shipper process (on Windows Agents) picks up this summary and sends it to the Ingress server.
- Decoupled from Findings: This is part of the Logging pipeline, not the Findings pipeline. Even if you have "Result Shipping" turned off, this log will still tell you that a scan happened and how many matches it found, even if it doesn't show you what those matches were.
Recommendations
- Always Enable in Production: This is one of the most important settings to keep enabled. It provides the baseline "proof of work" needed for almost all security and compliance programs.
- Use for "Speed" Troubleshooting: If users complain about agent performance, check these logs first. Compare the "Total Files Searched" against previous days to see if the scope of the scan has accidentally expanded.
- Audit-Ready: This is the primary log used to generate "Scan Completion" reports for leadership and external auditors.
Summary
The “Search Result” option is the "Scan Summary" setting. It provides a high-level "receipt" for every completed search in the Console logs, allowing you to track performance, verify that policies are being executed, and maintain a durable historical record of your data discovery efforts.
Locations Containing Matches
This is a reporting setting that instructs the Agent to send a list of every file path or location where sensitive data was found to the Console's Logs view.
What it does
When this setting is enabled, the Agent generates a log entry for every "hit" and transmits that metadata to the central Console.
- Path-Level Reporting: It sends the full path (for example,
C:\Users\JSmith\Documents\Client_List.xlsx) of any item that triggered a match based on your policy's Data Types. - Log-Based Visibility: These entries appear in the Logs tab of the Console.
- Distinction from "Results": It is important to understand that Spirion has two ways of showing findings:
- The Results Grid: The primary area for remediation (Shred, Redact, etc.).
- The Logs: A chronological audit trail.
- Enabling this setting puts the "where" of the findings into the Audit Log, providing a historical record that persists even after the results themselves might be remediated or cleared from the main grid.
Why it exists
This setting is used for Forensic Auditing and Long-Term Compliance:
- Permanent Audit Trail: While "Results" in the main grid are often "cleared" or "resolved" once a file is shredded, the Console Log serves as a permanent historical record. It enables an auditor to look back six months and see exactly where sensitive data used to be located.
- Centralized "Matching Locations": It mirrors the local "Do matching locations" setting but brings that data into the Cloud Console. This enables an admin to see findings across the entire enterprise in one scrolling log without opening individual reports.
- Secondary Verification: If there is ever a discrepancy in the Results grid, the "Locations Containing Matches" log acts as the "source of truth" for what the Agent actually discovered during the scan.
How it works in the architecture
- Event Generation: Every time a search worker identifies a match, it generates a "Match Location" event.
- Shipper Transmission: The Shipper process (on Windows Agents) bundles these location events and sends them to the Ingress server.
- High Volume Potential: Because this sends an entry for every file with a match, it can generate a significant amount of log traffic if you are scanning a "dirty" environment with thousands of sensitive files.
Recommendations
- Use with Caution in Large Environments: If you enable this for 5,000 machines that all have thousands of matches, your Console's Logs view will become extremely cluttered and difficult to navigate.
- Best for "High-Value" Targets: Enable this for policies targeting sensitive servers or executive workstations where you need a rigorous, permanent audit trail of every single location where risk was identified.
- Privacy Check: Like its local counterpart, this setting only logs the location (the path), not the actual sensitive values (the Social Security numbers or Credit Card numbers), ensuring that the logs themselves do not become a security risk.
Summary
The “Locations Containing Matches” option is the "Centralized Findings Audit" setting. It populates the Console logs with a detailed list of every file path containing sensitive data, providing a durable historical record of risk locations across the enterprise that remains accessible even after remediation actions are taken.
File Searched
This is the most verbose reporting setting available. It instructs the Agent to send a log entry to the central Console for every single file, email, or location it inspects, regardless of whether a match was found.
What it does
When this setting is enabled, the Agent generates a "heartbeat" for every item it touches during a scan and transmits that data to the Console's Logs view.
- Total Visibility: It provides a complete manifest of the Agent's search path in real-time. You will see a stream of logs like:
Inspected: C:\Windows\System32\drivers\etc\hostsInspected: C:\Users\JGreen\Desktop\Vacation_Photo.jpgInspected: C:\Users\JGreen\Documents\Resume.pdf
- Massive Data Volume: Because a typical modern computer contains hundreds of thousands (or millions) of files, enabling this setting results in an enormous amount of data being sent from the Agent to the SDP Cloud.
Why it exists
This setting is almost exclusively used for Deep-Dive Troubleshooting and Forensic Verification:
- Debugging "Stuck" Scans: If an Agent consistently stops at 45% completion, enabling "File Searched" enables an administrator to see the exact file the Agent was looking at right before it hung or crashed.
- Verifying Exclusions: If you have configured "Ignore" rules or "Exclusions" (e.g., "Don't scan the C:\Temp folder"), you can use this setting on a test machine to verify that the Agent is actually skipping those files as intended.
- Proof of Exhaustive Search: In extremely high-compliance scenarios, an auditor might demand proof not just of what you found, but proof that you actually checked every specific folder on a sensitive server.
How it works in the architecture
- The Ingress "Firehose": Every time a search worker thread opens a file, it triggers a "Location Searched" event.
- Shipper Saturation: The Shipper process must work overtime to bundle and send these millions of events to the Ingress server.
- Console Impact: This setting can significantly slow down the loading of the "Logs" tab in the Console because the database has to process and display a massive number of entries.
Recommendations
- ⚠️ WARNING: Do NOT enable this for production. Enabling "File Searched" for a large group of agents can overwhelm the Agent's network connection, saturate the Shipper queue, and potentially cause performance issues within your SDP Console.
- Use Only for Single-Machine Testing: This should only be enabled temporarily on a single machine for a very short period to troubleshoot a specific technical issue.
- Turn it off immediately: Once you have identified the file or folder causing an issue, disable this setting in the policy and "Save" to stop the data flow.
- Alternative: If you just need to know how many files were searched in total, use the "Search Result" log type instead. It provides the total count without listing every individual file path.
Summary
The “File Searched” option is the "Maximum Verbosity" setting. It turns the Console log into a "firehose" of every file path the Agent inspects. While invaluable for pinpointing exactly where a scan is failing or verifying exclusion rules, it generates too much data for general use and should be reserved strictly for short-term, targeted troubleshooting.
Location Searched
This is a high-verbosity reporting setting that instructs the Agent to send a log entry to the central Console for every top-level container or specific location it inspects.
While it is very similar to the "File Searched" setting, it is often used to track the progress of the Agent through its defined Search Locations (like specific drives, folders, or remote shares).
What it does
When this setting is enabled, the Agent generates a log entry every time it begins or completes the inspection of a specific location and transmits that to the Console's Logs view.
- Container-Level Tracking: It provides a record of the Agent moving through its task list. For example, you will see logs indicating when the Agent started scanning
C:\Users, when it moved toD:\Backups, or when it began searching a specific Remote File System. - Real-Time Progress: It enables an administrator to see exactly where an Agent is currently working in its search cycle from the central dashboard.
- High Data Volume: Like "File Searched," this setting generates a significant amount of log traffic, as it records every directory or container the Agent enters.
Why it exists
This setting is primarily used for Progress Monitoring and Troubleshooting:
- Identifying "Bottlenecks": If a scan is taking 24 hours to complete, enabling "Location Searched" helps you identify which specific folder or network share is causing the delay. You can see the timestamp when the Agent entered a folder and when it finally left it.
- Verifying Scope: It provides proof that the Agent actually reached and inspected the specific paths defined in the policy. If you told the Agent to scan a specific network path, this log confirms: "Yes, I successfully reached and searched that location."
- Debugging Connectivity: If an Agent is failing to scan a remote share, this log shows the exact moment the connection attempt was made, often followed by an "Error" log if the connection failed.
How it works in the architecture
- The Shipper Queue: As the Search Worker traverses the file system, it generates "Location" events. The Shipper process bundles these and sends them to the Ingress server.
- Windows Agent Focus: This is a feature of the Windows Agent's reporting engine, used to provide granular visibility into the distributed scanning process.
Recommendations
- Use for Performance Tuning: If you are trying to optimize your scan times, enable this on a few "slow" machines. It reveals if the Agent is spending 90% of its time in a single, massive archive folder, enabling you to exclude that folder or schedule it differently.
- Avoid Global Enablement: Do not enable this for your entire fleet. The volume of "Location" events can clutter the Console logs and make it difficult to find actual Errors or Warnings.
- Temporary Use Only: Like "File Searched," this should be treated as a diagnostic tool. Enable it to gather data, then disable it once you have the information you need.
Summary
The “Location Searched” option is the "Progress Tracker" setting for the Console. It provides a detailed audit trail of every directory and container the Agent inspects, making it an essential tool for troubleshooting slow scans, verifying search scope, and identifying specific folders that may be hindering agent performance.
Secure Item Skipped
This is a specialized reporting toggle used to track files that the Agent was unable to inspect due to encryption or password protection.
What it does
When this setting is enabled, the Agent sends a specific log entry to the central Console whenever it encounters a file it cannot "open" because the file is secured by a mechanism the Agent cannot bypass.
- Identifies "Dark Data": It flags files that are effectively "invisible" to the scanner. This includes password-protected PDFs, encrypted ZIP files, or Microsoft Office documents with "Open" passwords.
- Console Visibility: These entries appear in the Logs tab of the Console, typically identifying the file path and the reason it was skipped (e.g., "Encrypted" or "Password Protected").
- Audit Trail for Risk: It provides a list of locations where sensitive data might be hiding, but where Spirion cannot confirm its presence because of the file's security settings.
Why it exists
This setting is critical for Risk Assessment and Compliance:
- Closing Security Gaps: If a user is intentionally hiding sensitive data in password-protected ZIP files to avoid detection, this setting alerts the administrator to the existence of those files.
- Compliance Reporting: Many regulations (like HIPAA or PCI) require organizations to know where all sensitive data is. If 10% of your files are skipped because they are encrypted, you cannot technically claim 100% visibility. This log provides the "exception list" for your audit.
- Troubleshooting Policy: It helps you determine if you need to provide the Agent with a Password List (a feature in Spirion that enables the Agent to try known passwords) or if you need to reach out to specific users to have them decrypt files for scanning.
How it works in the architecture
- The Extraction Failure: When the Agent's "Any-File" extractor attempts to open a file and receives an "Encrypted" or "Password Required" flag from the OS or application, it triggers a "Secure Item Skipped" event.
- Shipper Transmission: If this log type is enabled in the policy, the Shipper process sends this event to the Console.
- Distinction from "Access Denied": This is different from a standard "Error" or "Access Denied" log. "Access Denied" means the Agent couldn't even touch the file; "Secure Item Skipped" means the Agent could touch the file but couldn't read its contents.
Recommendations
- Enable for High-Security Environments: If you are in a highly regulated industry, you should always enable this. Knowing what you can't see is just as important as knowing what you can see.
- Use to Refine Password Lists: If you see a high volume of "Secure item skipped" logs for a specific department, it may indicate that they use a standard departmental password for archives. You can then add that password to your Spirion policy to allow the Agent to scan those files in the future.
- Follow-up Action: Treat these logs as "Action Items." A "Secure item skipped" log should ideally lead to a conversation with the data owner to ensure the encrypted content is authorized and managed correctly.
Summary
The “Secure item skipped” option is the "Blind Spot Detector" for the Console. It ensures that encrypted or password-protected files do not go unnoticed, providing administrators with a clear list of "unscannable" locations that require manual review or additional credentials to secure.
Location Skipped
This is a reporting setting that instructs the Agent to notify the central Console whenever it bypasses a specific file, folder, or container based on pre-defined exclusion rules.
What it does
When this setting is enabled, the Agent sends a log entry to the Console every time it "decides" not to scan a location that it otherwise would have encountered.
- Reports Policy-Based Exclusions: It logs instances where the Agent skipped a location because of settings like "Ignore Folders," "Ignore File Extensions," or "Ignore Files Larger Than X MB."
- Confirmation of Logic: It provides a record that the Agent's exclusion logic is working. For example, if you have a policy to ignore the
C:\Windowsfolder, you will see a log entry confirming:Skipped: C:\Windows (Reason: Excluded by Policy). - Console Visibility: These entries appear in the Logs tab, providing a clear explanation for why certain areas of a disk or repository were not inspected.
Why it exists
This setting is primarily used for Policy Validation and Audit Transparency:
- Verifying "Ignore" Rules: When you create a new exclusion (e.g., "Ignore all .mp4 files"), you can enable this setting to verify that the Agent is actually skipping those files as intended. It prevents "guessing" whether a folder was skipped or simply contained no matches.
- Explaining "Missing" Results: If a stakeholder asks, "Why wasn't the 'Archive' folder scanned on this server?", the administrator can point to the "Location Skipped" log to show that it was intentionally bypassed due to a specific policy rule (e.g., the folder was too large or contained excluded file types).
- Optimizing Scan Performance: By reviewing these logs, an administrator can see if the Agent is spending a lot of time "evaluating" locations only to skip them. This can help in refining the Search Locations to be more efficient (e.g., instead of scanning
C:\and skippingC:\Windows, just scanC:\Users).
How it works in the architecture
- The Pre-Scan Filter: Before the Search Worker opens a file or enters a directory, it checks the path against the "Ignore" list in the policy.
- Event Generation: If a match is found in the ignore list, the Agent generates a "Location Skipped" event.
- Shipper Transmission: The Shipper process sends this event to the Ingress server for display in the Console.
Recommendations
- Use During Policy Development: This is an excellent tool to use when you are first building and testing your "Ignore" lists. It gives you immediate feedback that your filters are correctly configured.
- Disable for Broad Production Use: Like "File Searched," this can generate a high volume of logs if your exclusion rules are very broad (e.g., skipping thousands of system files). Once you have verified your policy is working, you should disable this to keep your Console logs clean.
- Distinguish from "Secure Item Skipped": Remember that "Location Skipped" is an intentional choice made by the policy (e.g., "Don't look here"), whereas "Secure Item Skipped" is a technical failure (e.g., "I tried to look here but it was locked").
Summary
The “Location Skipped” option is the "Exclusion Verifier" setting. It provides a transparent record of every location the Agent bypassed due to your policy's ignore rules, making it an essential tool for validating policy logic and proving to auditors that specific data sets were intentionally excluded from the search scope.
User Action
This setting is an auditing toggle that tracks interactive changes or commands initiated by a person at the endpoint.
What it does
When "User Action" is enabled, the Agent records and transmits a log entry to the central Console whenever a user interacts with the Spirion Agent interface on their local machine.
- Tracks Manual Intervention: It logs actions such as a user manually starting a scan, pausing a scan, or canceling a running task from the local Agent tray or UI.
- Remediation Auditing: If the policy enables "Manual Remediation" at the endpoint, this setting logs when a user clicks to Shred, Scrub (Redact), or Quarantine a file locally.
- Configuration Changes: It logs if a user attempts to modify local settings, such as changing the scan throttle (CPU usage) or adding a local "Ignore" rule, provided the policy grants them those permissions.
- Console Visibility: These entries appear in the Logs tab of the Console, identifying the specific user account that performed the action.
Why it exists
This setting is critical for Accountability and Governance:
- Monitoring "Shadow" Activity: In environments where users have some control over the Agent, administrators need to know if a user is "killing" scans to avoid detection or if they are manually starting scans outside of the scheduled window.
- Remediation Audit Trail: If a critical file is accidentally shredded, the "User Action" log provides the "Who, What, and When." It proves that a human initiated the deletion, which is vital for incident response and distinguishing between automated policy actions and manual user choices.
- Compliance with "Dual Control": For organizations that require a record of all data destruction, this setting ensures that every manual "Shred" action is centralized in the Cloud Console for permanent record-keeping.
How it works in the architecture
- UI Event Trigger: The local Agent's User Interface (UI) module monitors for button clicks or command inputs. When a relevant action occurs, it sends a signal to the logging module.
- Shipper Transmission: The Shipper process bundles the "User Action" event and sends it to the Ingress server.
- User Context: The log entry includes the Windows/Mac username of the person logged into the machine at the time of the action, ensuring the audit trail is tied to a specific identity.
Recommendations
- Essential for "Attended" Scans: If you allow your employees to run Spirion manually (e.g., "Self-Service" scanning), you must enable this. Without it, you will have no visibility into what your users are doing with the tool.
- Use for Troubleshooting "Missing" Scans: If a scheduled scan consistently fails to finish on a specific machine, check the "User Action" logs. You might find that the user is manually canceling the scan every morning when they start work.
- Security Best Practice: Even if you don't expect users to interact with the Agent, keep this enabled. It serves as a "tamper-evident" log that alerts you if someone is trying to interfere with the platform's operation.
Summary
The “User Action” option is the "Human Activity Audit" setting. It ensures that any manual interaction with the Spirion Agent—from starting a scan to shredding a file—is recorded in the central Console, providing the accountability and transparency needed to manage a distributed data protection program.
Send Logs
This setting is the master "On/Off" switch for the entire Agent-to-Console logging pipeline.
What it does
This setting determines whether the local Agent is permitted to transmit any log data to the central SDP Cloud Console.
- The Gateway Control: If this is unchecked (Off), the Agent does not send any log events to the Console, regardless of what you have selected in the "Log type" checkboxes (like Error, Information, or Search Result).
- Enables Remote Visibility: When checked (On), it opens the communication channel that enables the Agent's Shipper process to package log events and send them to the Ingress server for display in the Console's "Logs" and "Status" views.
- Decoupled from Local Logging: This setting affects only the upload to the Console. It does not stop the Agent from writing logs to the local disk (for example, the
IdentityFinder.logfile). It simply controls whether that information is shared with the central management platform.
Why it exists
This setting is used for Privacy, Bandwidth Management, and Global Policy Control:
- Privacy and Compliance: In some highly restrictive regions (such as those governed by strict works council rules or specific GDPR interpretations), an organization may be prohibited from centralizing logs that contain usernames or file paths. Unchecking "Send Logs" ensures that all activity data stays strictly on the local endpoint.
- Bandwidth Conservation: In environments with extremely limited network connectivity (e.g., remote field sites or satellite links), administrators may disable "Send Logs" to prevent the Agent from consuming precious bandwidth with routine status updates.
- Noise Management: If an administrator is performing a massive "Initial Discovery" scan across 50,000 endpoints and doesn't want to overwhelm the Console's database with millions of "Search Started" events, they might temporarily disable "Send Logs" until the initial rollout is complete.
How it works in the architecture
- The Shipper Filter: The Shipper process (the component responsible for outbound communication) checks this policy setting before every transmission attempt. If "Send Logs" is disabled, the Shipper will ignore any log events generated by the Search Worker and will not attempt to connect to the Ingress logging endpoint.
- Status vs. Logs: It is important to note that even with "Send Logs" disabled, the Agent will usually still send a basic Heartbeat (to show it is "Online"). However, the detailed history of what it did during a scan will be missing from the Console.
Recommendations
- Default to "On": For almost all standard deployments, "Send Logs" should be enabled. Without it, you lose the ability to monitor the health and progress of your scans from the central dashboard, making it nearly impossible to troubleshoot issues at scale.
- The "Silent Agent" Strategy: Only disable this if you have a specific legal or technical requirement to keep the Agent "silent." If you do disable it, remember that you must manually collect log files from individual machines if a scan fails.
- Troubleshooting Tip: If you see that an Agent is "Online" in the Console but its "Last Scan" or "Log" history is completely empty, the first thing you should check is whether "Send Logs" has been accidentally unchecked in the policy.
Summary
The “Send Logs” setting is the "Communication Toggle" for the platform. It acts as the primary authorization for the Agent to share its operational history with the Console. When enabled, it provides the visibility needed for centralized management; when disabled, it keeps all activity data local to the endpoint for maximum privacy or bandwidth savings.
Standard Operations
The “Standard Operations” option for the Log type setting (found under the Console section of the Local Logging page) is the baseline operational reporting level. It is designed to provide a clear, high-level summary of the Agent's primary lifecycle events without overwhelming the Console with granular detail.
- Default - The “Default” option is a configuration shortcut that applies the Spirion-recommended baseline for operational visibility.
- Selecting "Default" automatically checks a specific subset of the logging toggles that Spirion engineering has determined provides the best balance between useful information and system performance.
- The “Default” option is the "Best Practices" toggle. It configures the Agent to report the essential milestones and health updates needed for effective management while protecting the platform from the performance overhead of excessive logging.
- While the exact "Default" set can vary slightly by product version, it typically enables the following:
- Standard Operations: The core "Milestone" logs (Search Started, Search Completed, Policy Applied).
- Log Informational Messages: Routine status updates that confirm the Agent is healthy and communicating.
- Error/Warning Logs: (Implicitly included in the default reporting profile) to ensure failures are always visible.
- The "Default" setting is designed for Ease of Use and Safety:
- Prevents "Log Flooding": By using the Default, an administrator avoids accidentally enabling high-verbosity settings (like "Trace" or "File Searched") that could overwhelm the Console or slow down the endpoint.
- Standardizes Reporting: It ensures that all agents in a specific group are reporting the same level of detail, making it easier to build consistent dashboards and reports.
- Best Practice Alignment: It aligns the customer's environment with the logging levels that Spirion Support expects to see when performing a routine health check.
- Recommendations
- The "Safe Harbor" Setting: If you are unsure which logging levels you need, always choose Default. It provides enough information to troubleshoot 90% of common issues without any risk to performance.
- Baseline for Production: For 95% of your endpoints (especially standard workstations), the Default setting is sufficient.
- Troubleshooting Step: If you have been using "Debug" or "Trace" logging to solve a problem, selecting "Default" is the quickest way to return the Agent to its "clean" production state once the issue is resolved.
- Log Informational Messages - A verbosity toggle that enables Level 1 (Information) logging. It is the first step up from basic milestone reporting.
- The “Log Informational Messages” option is the "System Pulse" setting. It provides a steady stream of routine status updates that confirm the Agent is healthy, synchronized, and ready for work, making it an excellent baseline setting for administrators who want more than just "Start/Stop" visibility.
- When enabled, the Agent transmits "routine" status updates to the Console that describe the normal, healthy functioning of the Agent's internal components. While "Standard Operations" focuses on the results of actions (e.g., "Scan Completed"), "Log Informational Messages" focuses on the process.
- Reports Routine System Events: It logs non-critical events that confirm the Agent is performing its background tasks correctly.
- Key Events Included:
- Heartbeat Confirmations: Detailed logs of the Agent checking in with the Console.
- Service State Changes: When internal modules (like the Endpoint Service or the Search Worker) initialize or enter an idle state.
- Configuration Syncs: Confirmation that the Agent has checked for a new policy, even if no changes were found.
- Target Enumeration Progress: High-level updates as the Agent moves through different phases of a scan (e.g., "Starting enumeration of File Share X").
- Low-Noise Detail: These messages are "positive" confirmations—they tell you that things are working as intended.
- This setting is used for Proactive Monitoring and Baseline Verification:
- Confirming "Liveness": If an Agent hasn't run a scan in a week, "Standard Operations" will be empty. Enabling "Log Informational Messages" enables you to see that the Agent is still "alive," checking for policies, and heartbeating correctly.
- Validating Schedules: It helps you verify that a scheduled task is actually being "queued" by the Agent, even before the scan officially starts.
- Audit of Non-Events: For compliance purposes, it provides a record that the Agent was active and "on duty" during a specific time window, even if no sensitive data was found and no errors occurred.
- Log Debugging Messages - A diagnostic toggle that enables Level 2 (Debug) logging. It sits between "Standard Operations" and the extreme "Trace" level.
- The “Log Debugging Messages” option is the "Administrator's Diagnostic" setting. It provides the technical "reasoning" behind the Agent's actions, making it the primary tool for troubleshooting permission issues, connectivity failures, and complex policy behaviors without the extreme overhead of full Trace logging.
- When enabled, the Agent transmits technical "behind-the-scenes" messages to the Console that explain why the Agent is taking certain actions. While "Standard Operations" tells you what happened (for example, "Scan Started"), "Log Debugging Messages" provides the technical context.
- Intermediate Verbosity: It is significantly more detailed than "Log All Messages" but avoids the raw code-level "noise" of "Trace Messages."
- Technical Logic Tracking: It logs internal decision points, such as:
- Credential Usage: Which specific credential set was selected for a target.
- Filter Evaluation: Why a specific file was included or excluded based on complex logic.
- Pipeline Status: Detailed updates on the state of the local
job_queueandshipper_queue. - Connectivity Handshakes: The specific steps taken to establish a connection with a remote share or database before the actual scan begins.
- This setting is the "go-to" tool for Support Engineers and Administrators when standard logs aren't enough to explain a behavior:
- Troubleshooting Permissions: If an Agent is failing to scan a specific folder, Debugging Messages will often show the specific OS error code or "Access Denied" response that the Agent received from the file system.
- Verifying Policy Logic: If you have a complex policy with multiple "AND/OR" conditions, this setting helps you see how the Agent is interpreting those rules in real-time.
- Diagnosing "Slow" Scans: It provides more granular timestamps for internal tasks, allowing you to see if the Agent is spending an unusual amount of time in the "Enumeration" (Discovery) phase versus the "Search" phase.
- Recommendations:
- Use for "Level 2" Troubleshooting: If you've checked the standard logs and still don't understand why a scan is failing, this is the next logical step.
- Temporary Enablement: Enable it for a specific scan window to capture the behavior, then disable it. It is not intended to be a "permanent" setting for production agents.
- Great for New Target Setup: When you are configuring a new, complex target (like a specific SQL database or a custom Cloud connector), enable this to ensure the connection and authentication steps are working exactly as expected.
- Log Detailed Trace Messages - This is the highest possible level of diagnostic logging available for the Agent.
- The “Log Detailed Trace Messages” option is the "Engineering Debug" setting. It provides a raw, line-by-line look at the Agent's internal code execution. Because of its extreme verbosity and potential impact on performance, it should only be used under the direct guidance of Spirion technical support for troubleshooting the most complex product defects.
- When this setting is enabled, the Agent generates "Trace-level" logs, which provide a line-by-line account of the code execution and internal logic. This is essentially "Developer Mode" for the Agent's reporting.
- Code-Level Visibility: It logs the most granular internal operations, such as specific API calls, memory management events, and the exact parameters being passed between internal software modules.
- Deep Inspection Details: It may include details about how the "Any-File" engine is decomposing a specific file type or how the regex engine is evaluating a specific string of text.
- Extreme Data Volume: This setting generates a massive "firehose" of data. A single minute of scanning with Trace logging enabled can produce thousands of log entries.
- Recommendations:
- ⚠️ WARNING: NEVER enable this without being asked by Spirion Support. Enabling "Log Detailed Trace Messages" across a fleet of agents can cause significant performance degradation on the endpoints and potentially saturate your network and Console database.
- Single-Machine, Short-Duration Only: This should only be enabled on one machine for a very specific, timed test (e.g., "Enable, run scan for 5 minutes, reproduce the crash, disable immediately").
- Manual Log Collection: Often, when Trace logging is required, it is better to collect the logs locally from the machine rather than sending them to the Console, as the Console may truncate or struggle to display the full volume of Trace data.
- Log All Messages - A high-verbosity toggle that expands the "Standard Operations" reporting level to include every operational event generated by the Agent.
- This option is the "Milestone Reporting" setting. It provides a concise, high-level audit trail of the Agent's most important actions—starting scans, finishing scans, and updating policies—ensuring that administrators have the "big picture" visibility needed to verify that the data protection program is active and healthy.
- While the base "Standard Operations" setting only reports major milestones (like Search Started and Search Completed), checking “Log All Messages” removes the filter and instructs the Agent to send every non-error operational message to the Console.
- Maximum Operational Detail: It includes minor status updates that are usually hidden, such as:
- Individual target connection successes.
- Internal service heartbeats and state changes.
- Detailed policy synchronization steps.
- Thread-level start/stop notifications for the search worker.
- Verbose Timeline: It transforms the Console's Logs view from a summary of "what happened" into a minute-by-minute diary of the Agent's internal logic.
- This setting is used for Advanced Troubleshooting and Performance Auditing:
- Pinpointing "Silent" Failures: If a scan isn't throwing an "Error" but is behaving unexpectedly (e.g., finishing too quickly or not scanning a specific sub-folder), "Log All Messages" reveals the internal decision-making process of the Agent.
- Analyzing Distributed Scans: For non-local scans involving multiple agents, this setting helps you see exactly how work is being distributed and if specific "Search Agents" are successfully pulling work items from the "Discovery Agent."
- Network/Latency Analysis: By seeing the timestamps of every minor operation, an administrator can identify if the Agent is experiencing "micro-delays" when communicating with a specific database or file share.
- Why it exists
- The Standard Operations setting is the primary tool for General Health Monitoring and Executive Reporting:
- Proof of Execution: It provides the simplest "Yes/No" answer to the question: "Did the scan run?" By looking at the "Standard Operations" logs, an admin can see the "Started" and "Completed" timestamps for every machine in the fleet.
- Operational Verification: It confirms that the Agent is successfully communicating with the Console. If you see a "Policy Applied" log, you know the Agent is "listening" and up-to-date.
- Clean Audit Trail: Unlike the "Information" setting (which might log every minor heartbeat or internal check), "Standard Operations" focuses only on the events that an auditor or manager would actually care about.
- Performance Impact - Because it only sends a few entries per scan (Start, End, Policy Update), it has a negligible impact on network performance and database storage.
- Recommendations:
- The "Set it and Forget it" Setting: This should be enabled by default for ALL of your Agents. It provides the minimum necessary visibility to manage a Spirion deployment effectively.
- Use for Dashboards: The data generated by "Standard Operations" is what typically populates the "Scan Status" widgets and "Recent Activity" feeds in the SDP Console.
- Distinction from "Search Result": While "Standard Operations" tells you when a scan started and finished, the "Search Result" log type (often used alongside it) tells you what the scan found (total match counts). Together, they provide a complete picture of the scan's success.
Discovery Teams
- Disabled - This is the configuration that suppresses all coordination-specific reporting for distributed scans.
- The “Disabled” option for Discovery Teams is the "Silent Coordination" setting. It enables Agents to work together in a distributed team without sending the technical details of that teamwork to the Console, ensuring maximum performance and a clean audit trail focused strictly on scan results and errors.
- When "Disabled" is selected, the Agent will not send any logs to the Console regarding its interactions with other agents in a Discovery Team.
- Silences Team "Chatter": It stops the reporting of work-unit requests, task assignments, and the technical handshakes between the Discovery Agent (coordinator) and Search Agents (workers).
- Focuses on the Individual: The Agent will still report its own "Standard Operations" (like when it starts or stops a scan), but it will not report its status as a "member of a team."
- Zero Coordination Visibility: In the Console's Logs view, you will see that a scan ran, but you will not see the granular breakdown of which agent handled which specific "chunk" of the remote target.
- Why it exists
- The "Disabled" setting is used for Performance Optimization and Noise Reduction:
- Maximizing Efficiency: In very large environments with hundreds of agents participating in a single distributed scan, the coordination logs can become voluminous. Disabling them reduces the load on the Agent's Shipper and the Console's Ingress server.
- Reducing Console Clutter: If your distributed scans are running reliably and you only care about the final results (the sensitive data found), disabling these logs keeps your Logs tab clean and focused on critical errors or security events.
- Privacy/Security Hardening: In highly sensitive environments, an organization may wish to minimize the amount of metadata (such as internal file paths or object IDs) being transmitted as part of the coordination logs.
- No Impact on Search: Disabling these logs does not stop the Discovery Team from working. The agents will still distribute the workload and find sensitive data exactly as configured; they just won't "talk about it" in the logs.
- Recommendations
- The Production Standard: For mature environments where distributed scans are stable and well-understood, "Disabled" is a perfectly valid setting to save bandwidth and storage.
- The "Blind Spot" Risk: Be aware that if a distributed scan fails or "hangs" while this is disabled, you will have very little information to help you understand why. You will see that the scan didn't finish, but you won't know which agent got stuck or which folder caused the issue.
- Toggle for Triage: A common best practice is to keep this Disabled during normal operations and only switch it to Standard Logging if you notice a distributed scan is taking longer than usual or failing to complete.
- Standard Logging - A reporting toggle that controls the visibility of distributed workload coordination events.
- This is the "Teamwork Audit" setting. It provides visibility into how distributed scan tasks are being distributed and completed across a pool of agents, ensuring that administrators can verify the efficiency and health of large-scale, multi-agent discovery efforts.
- When this setting is enabled, the Agent (specifically when acting as a member of a Discovery Team) transmits log entries to the Console that describe how it is participating in a distributed scan.
- Reports Team Coordination: It logs events related to the "handshake" between the Discovery Agent (the coordinator) and the Search Agents (the workers).
- Key Events Include:
- Work Item Retrieval: When a Search Agent successfully pulls a new task or "chunk" of work from the team's queue.
- Task Completion Status: When an agent notifies the team coordinator that it has finished its assigned portion of a remote target (e.g., a specific folder on a file share).
- Team Membership Updates: Confirmation that the agent has successfully joined or checked into the Discovery Team for a specific job.
- Console Visibility: These entries appear in the Logs tab, allowing an administrator to see how a large, non-local scan is being "fanned out" across multiple agents.
- Why it exists:
- This setting is essential for Monitoring Distributed Scan Health:
- Verifying Load Balancing: It provides proof that the workload is actually being split. If you have 10 agents in a Discovery Team but only see "Standard Logging" entries for two of them, you know that the other eight agents may have connectivity or permission issues preventing them from pulling work.
- Troubleshooting "Stuck" Scans: If a massive scan of a multi-terabyte file share seems to have stopped, these logs help you identify which specific "chunk" of work is currently being processed and which agent is handling it.
- Performance Tuning: By reviewing these logs, an administrator can see if agents are spending too much time "waiting" for work items, which might indicate that the Discovery Agent (the coordinator) is a bottleneck.
- Recommendations:
- Enable for All Distributed Scans: If you are using Discovery Teams to scan large remote targets (like M365, SQL, or large File Shares), you should always enable this. Without it, a distributed scan looks like a "black box" in the Console, and you won't be able to tell if all your workers are contributing.
- Use to Identify "Lazy" Workers: If you suspect some agents in your team aren't doing their fair share of the work, check these logs. You'll quickly see which agents are successfully claiming work items and which are silent.
- Distinguish from "Search Result": Remember that this logs the process of working as a team. The actual findings (the sensitive data matches) are still handled by the standard result shipping pipeline.
- Additional Logging - This is a high-verbosity diagnostic toggle used to troubleshoot the internal mechanics of distributed scanning.
- While "Standard Logging" for Discovery Teams tells you that an Agent picked up a task, “Additional Logging” provides the technical details of how that coordination happened. It exposes the low-level communication between the Discovery Agent (the coordinator) and the Search Agents (the workers).
- The “Additional Logging” option for Discovery Teams is the "Distributed Debug" setting. It provides a deep-dive look into the technical communication and work-assignment logic used by a pool of agents, making it the primary tool for solving complex performance or coordination issues in large-scale distributed discovery jobs.
- Detailed Work Distribution: It logs the specific metadata of the "work units" being passed around, including the exact paths or object IDs being assigned to specific agents.
- Queue Interaction Details: It provides granular updates on how agents are interacting with the distributed queue, including retry attempts, timeout events, and "heartbeats" specific to the Discovery Team session.
- Resource Negotiation: It logs the technical handshakes used when an agent "claims" a piece of work to ensure no two agents scan the same file simultaneously.
- Console Visibility: These entries appear in the Logs tab, often with technical prefixes that describe the internal state machine of the Discovery Team.
- Why it exists:
- This setting is used for Advanced Troubleshooting of Distributed Scans:
- Diagnosing "Work Starvation": If you have a Discovery Team that isn't finishing a scan, this setting helps you see if the Search Agents are trying to pull work but receiving "Empty Queue" or "Access Denied" responses from the coordinator.
- Identifying Coordination Bottlenecks: It reveals if the Discovery Agent is struggling to keep up with the "Work Item" requests from a large number of Search Agents, which can happen in very high-speed network environments.
- Debugging "Double Scanning": If you suspect that two agents are accidentally scanning the same data, these logs provide the audit trail of which agent claimed which specific work unit and when.
- Recommendations:
- ⚠️ Use Only for Troubleshooting: Do not leave this enabled for routine production scans. The volume of data can make your Console logs difficult to read and adds unnecessary overhead to your agents.
- Targeted Debugging: Only enable this if you are experiencing a specific issue with a Discovery Team (e.g., the scan is hanging, or agents aren't picking up work) that "Standard Logging" cannot explain.
- Pair with "Log Debugging Messages": If you are truly stuck, enabling both "Additional Logging" (for the team coordination) and "Log Debugging Messages" (for the agent's internal logic) provides the most complete picture of a distributed scan failure.
- Comprehensive Logging - The maximum verbosity level for distributed scanning operations. It is the "Trace" equivalent specifically for the Discovery Team coordination engine.
- This is the "Deep-Dive Engineering" setting for distributed scans. It provides a total, unfiltered audit of the communication between agents, making it the ultimate tool for solving the most complex "under-the-hood" failures in Spirion's multi-agent scanning architecture.
- When enabled, the Agent records every single interaction, packet, and state change involved in the distributed scanning process. It provides a "microscopic" view of how the Discovery Agent (the coordinator) and Search Agents (the workers) are talking to each other.
- Full Protocol Trace: It logs the raw technical handshakes and the full content of the "Work Unit" definitions being passed between agents.
- Granular Queue State: It records every internal update to the distributed task list, including "lock" and "unlock" events for every individual file or object being searched.
- Sub-Task Milestones: It tracks the progress of every minor sub-task, providing a second-by-second account of how a large job is being decomposed and executed.
- Extreme Verbosity: This setting generates a massive volume of data, as it logs every "ask" and "answer" between the agents in the team.
- Why it exists
- This setting is reserved for Engineering-Level Debugging of Distributed Architecture:
- Solving Race Conditions: If two agents are somehow trying to claim the same file at the exact same millisecond, "Comprehensive Logging" provides the timing data needed to identify the conflict.
- Debugging Complex Network Interference: If a firewall or load balancer is silently dropping the coordination packets between agents, this level of logging reveals exactly where the communication chain is breaking.
- Analyzing "Stuck" Discovery: If the Discovery Agent (the coordinator) is failing to enumerate a target but isn't throwing a standard error, this setting shows the raw responses it is receiving from the target system (e.g., M365 or a SQL server).
- Recommendations:
- ⚠️ WARNING: Use only under Support guidance. You should almost never enable "Comprehensive Logging" on your own. It is designed to help Spirion Engineering diagnose product defects in the distributed scanning engine.
- Short-Burst Only: If you must use it, enable it for a very short window (e.g., 2–5 minutes) to capture a specific failure, then disable it immediately.
- Performance Risk: On very large Discovery Teams (e.g., 20+ agents), enabling this can actually slow down the scan itself because the agents spend so much time writing and shipping logs.
- Full Logging - This is a legacy or "all-encompassing" toggle that enables every available logging level for distributed scanning coordination.
- *This setting applies Windows and Linux only.
- The “Full Logging” option for Discovery Teams is the "Total Visibility" setting for distributed scans. It provides an unfiltered, exhaustive record of how agents coordinate work, making it the most powerful—and most resource-intensive—diagnostic tool for troubleshooting Spirion's multi-agent architecture.
- When "Full Logging" is selected, it acts as a "Select All" for the Discovery Teams category. It instructs the Agent to record and transmit every possible event related to its participation in a Discovery Team, from high-level milestones to low-level technical handshakes.
- Combines All Levels: It effectively merges Standard, Additional, and Comprehensive logging into a single stream.
- Total Coordination Visibility: It logs:
- When the agent joins or leaves a team.
- Every work item requested, received, and completed.
- The raw technical metadata of the work units.
- Internal state changes and "heartbeats" between the coordinator and the worker.
- Maximum Verbosity: Like "Comprehensive Logging," this produces a massive volume of data that can quickly fill the Console's log view.
- Why it exists
- This setting is used for Total System Auditing and Critical Failure Analysis:
- The "Catch-All" for Troubleshooting: If a distributed scan is failing and you don't know if the issue is high-level (coordination) or low-level (technical handshakes), "Full Logging" ensures you capture everything in one go.
- Engineering Diagnostics: It provides Spirion developers with the complete "story" of a distributed scan, allowing them to trace a single work item from its creation on the Discovery Agent to its final completion on a Search Agent.
- Verification of Complex Environments: In environments with complex networking (multiple VLANs, firewalls, or proxies between agents), this setting helps verify that every layer of the Discovery Team protocol is functioning correctly.
- Note: Significant Resource Impact. Because every interaction is logged, this setting can increase the load on the Agent's CPU and the local Postgres
shipper_queue. Console Noise: The Logs tab in the Console will be dominated by technical "chatter" that is often difficult for human administrators to interpret without assistance from Spirion Support.
- Recommendations:
- ⚠️ Use with Extreme Caution: Do not enable "Full Logging" for general production use. It is a diagnostic tool intended for short-term use while investigating a specific problem.
- Support-Led Debugging: This is typically the setting Spirion Support will ask you to enable if they suspect a bug in the distributed scanning engine or a major communication failure between agents.
- Disable Immediately After Testing: Once you have reproduced the issue you are troubleshooting, uncheck "Full Logging" to prevent your agents and Console from being overwhelmed by unnecessary data.
Location Based Operations
- Default - This is the configuration that suppresses all coordination-specific reporting for distributed scans.
- The “Disabled” option for Discovery Teams is the "Silent Coordination" setting. It enables Agents to work together in a distributed team without sending the technical details of that teamwork to the Console, ensuring maximum performance and a clean audit trail focused strictly on scan results and errors.
- When "Disabled" is selected, the Agent does not send any logs to the Console regarding its interactions with other agents in a Discovery Team:
- Silences Team "Chatter": It stops the reporting of work-unit requests, task assignments, and the technical handshakes between the Discovery Agent (coordinator) and Search Agents (workers).
- Focuses on the Individual: The Agent still reports its own "Standard Operations" (like when it starts or stops a scan), but it does not report its status as a "member of a team."
- Zero Coordination Visibility: In the Console's Logs view, you will see that a scan ran, but you will not see the granular breakdown of which agent handled which specific "chunk" of the remote target.
- Why it exists
- The "Disabled" setting is used for Performance Optimization and Noise Reduction:
- Maximizing Efficiency: In very large environments with hundreds of agents participating in a single distributed scan, the coordination logs can become voluminous. Disabling them reduces the load on the Agent's Shipper and the Console's Ingress server.
- Reducing Console Clutter: If your distributed scans are running reliably and you only care about the final results (the sensitive data found), disabling these logs keeps your Logs tab clean and focused on critical errors or security events.
- Privacy/Security Hardening: In highly sensitive environments, an organization may wish to minimize the amount of metadata (such as internal file paths or object IDs) being transmitted as part of the coordination logs.
- No Impact on Search: Disabling these logs does not stop the Discovery Team from working. The agents will still distribute the workload and find sensitive data exactly as configured; they just won't "talk about it" in the logs.
- Recommendations
- The Production Standard: For mature environments where distributed scans are stable and well-understood, "Disabled" is a perfectly valid setting to save bandwidth and storage.
- The "Blind Spot" Risk: Be aware that if a distributed scan fails or "hangs" while this is disabled, you will have very little information to help you understand why. You will see that the scan didn't finish, but you won't know which agent got stuck or which folder caused the issue.
- Toggle for Triage: A common best practice is to keep this Disabled during normal operations and only switch it to Standard Logging if you notice a distributed scan is taking longer than usual or failing to complete.
- Log Informational Messages
- A verbosity toggle that enables Level 1 (Information) reporting specifically for distributed scanning coordination.
- The “Log Informational Messages” option for Discovery Teams is the "Team Pulse" setting. It provides routine status updates that confirm your agents are successfully coordinated, checked-in, and ready to perform distributed work, making it an ideal setting for administrators who want to verify the health of their multi-agent scanning infrastructure.
- When enabled, the Agent transmits routine, non-critical status updates to the Console that confirm the "health" of the distributed scanning process. While "Standard Logging" for Discovery Teams focuses on the completion of tasks, "Log Informational Messages" focuses on the readiness and participation of the team members.
- Reports Routine Team Events: It logs the "positive" confirmations that the distributed engine is functioning correctly.
- Key Events Included:
- Team Check-ins: Confirmation that a Search Agent has successfully contacted the Discovery Agent (coordinator) and is standing by for work.
- Queue Polling: Periodic logs showing that an idle agent is successfully checking the work queue, even if no new work is currently available.
- Session Initialization: Detailed steps of the agent joining the specific "Discovery Team session" for a scheduled job.
- Capacity Updates: When an agent reports its current thread availability or "readiness" to the coordinator.
- Low-Noise Detail: These messages provide a "pulse" for the team, proving that the agents are coordinated and ready, even during gaps in the actual scanning activity.
- Why it exists
- This setting is used for Proactive Team Monitoring and Verification:
- Confirming "Worker Readiness": If you have a large pool of Agents, this setting enables you to verify that all of them are successfully "checking in" to the team, even before the scan reaches their specific part of the target.
- Auditing Distributed Availability: It provides a record that a specific agent was "on duty" and available to help with a distributed scan, which is useful for verifying that your load-balancing strategy is working.
- Distinguishing "Idle" from "Broken": If a scan is taking a long time, these logs help you distinguish between an agent that is idle (waiting for the coordinator to find more files) and an agent that is broken (not communicating with the team at all).
- How it works in the architecture
- The Coordination Pulse: In a Discovery Team, Agents must stay in sync. "Log Informational Messages" captures the routine "I'm here and ready" chatter that keeps the team organized.
- Minimal Performance Impact: These messages are infrequent and small. Enabling this for a Discovery Team typically has a very low impact on network bandwidth or Console storage.
- Console Visibility: These entries appear in the Logs tab, providing a steady stream of "healthy" updates during a distributed scan.
- Recommendations
- Excellent for New Teams: When you first set up a Discovery Team, enable this to ensure all your intended "Search Agents" are successfully joining the team and checking for work.
- Baseline for Large Scans: For very long-running scans (for example, a multi-day scan of a massive file share), this setting provides peace of mind by showing that the workers are still active and connected to the coordinator.
- Safe for Production: Like the "Standard" level, this is generally safe to leave enabled if you want a more detailed audit trail of how your distributed scanning resources are being utilized.
- Log Debugging Messages - This is a diagnostic toggle that enables Level 2 (Debug) logging for the distributed scanning engine.
- The “Log Debugging Messages” option for Discovery Teams is the "Distributed Diagnostic" setting. It provides the technical reasoning behind how work is distributed and coordinated across a pool of agents, making it the essential tool for troubleshooting load-balancing issues, connectivity blocks, and complex distributed scan failures.
- When enabled, the Agent transmits technical "behind-the-scenes" messages to the Console that explain the logic and decision-making of the Discovery Team coordination. While "Standard Logging" tells you what the team did, "Log Debugging Messages" tells you why the coordination is behaving a certain way.
- Technical Coordination Logic: It logs internal decision points for the distributed workload, such as:
- Work Item Negotiation: Why a specific agent was assigned a certain "chunk" of data over another.
- Queue Priority: How the Discovery Agent (coordinator) is prioritizing different parts of the scan scope.
- Connectivity Handshakes: Detailed technical steps taken to establish the peer-to-peer or coordinator-to-worker connection.
- Throttling and Backoff: If an agent is slowing down its requests for work due to network latency or coordinator load, the "Debug" logs will show the specific reason for the delay.
- Intermediate Verbosity: It provides significantly more technical detail than "Informational Messages" but stops short of the raw code-level "Trace" data found in "Comprehensive" or "Full" logging.
- Why it exists
- This setting is the primary tool for Administrators and Support Engineers when a distributed scan is behaving unexpectedly:
- Troubleshooting "Uneven" Workloads: If one agent is doing 90% of the work while others stay idle, Debugging Messages will reveal if the idle agents are failing their "handshake" with the coordinator or if the coordinator is rejecting their requests for work.
- Diagnosing Network/Firewall Blocks: It often captures the specific OS or network error codes (e.g., "Connection Refused" or "Timeout") that occur when agents try to communicate across different network segments.
- Verifying Team Configuration: It helps confirm that the agents are correctly identifying the "Discovery Agent" and are using the expected ports and protocols to join the team.
- Performance Impact: It increases the volume of data sent to the Console. While not as resource-heavy as "Full Logging," it can still generate thousands of entries during a large, complex scan.
- Recommendations
- The "Go-To" for Team Issues: If your Discovery Team isn't working as expected, this is the first setting you should enable. It usually provides enough information to identify 90% of coordination problems.
- Temporary Enablement: Enable it to capture the behavior of a specific job, then disable it once you have the logs you need. It is not intended for permanent production use.
- Check the "Coordinator" First: When troubleshooting a Discovery Team, pay closest attention to the Debug logs from the Discovery Agent (the coordinator), as it is the "brain" of the operation and usually holds the most important diagnostic data.
- Log Detailed Trace Messages - This is the highest possible level of diagnostic verbosity for distributed scanning. It is the "Code-Level Trace" for the coordination engine.
- This option provides an exhaustive, code-level audit of the communication between Agents in a distributed team, making it the ultimate (and most resource-heavy) tool for solving the most difficult "under-the-hood" failures in Spirion's distributed architecture.
- When enabled, the Agent records every single low-level technical event, packet exchange, and internal function call related to the Discovery Team coordination. It provides a "frame-by-frame" view of how the Discovery Agent (the coordinator) and Search Agents (the workers) interact.
- Raw Protocol Capture: It logs the exact contents of the messages sent between agents, including the raw XML or JSON structures used to define "Work Units."
- Internal State Transitions: It records every time the coordination engine changes its internal status (for example, "Waiting for Work," "Negotiating Lock," "Acknowledging Receipt").
- Micro-Timing Data: It provides high-precision timestamps for every interaction, which is used to identify millisecond-level delays or "race conditions" in the distributed queue.
- Extreme Data Volume: This setting generates a massive amount of log data. A single agent can produce thousands of log lines in just a few minutes of scanning.
- Why it exists:
- This setting is almost exclusively used for Engineering-Level Debugging:
- Identifying Product Defects: If there is a suspected bug in how Spirion handles distributed workloads (for example, a "deadlock" where agents stop talking to each other), this level of logging is required to find the root cause in the code.
- Solving Complex Network Interference: If a deep-packet inspection (DPI) firewall or a sophisticated load balancer is subtly altering the coordination traffic, "Detailed Trace" will show exactly how the received data differs from the sent data.
- Analyzing High-Scale Failures: In environments with massive Discovery Teams (for example, 50+ agents), this setting helps engineers understand how the coordination engine scales and where it might be hitting internal resource limits.
- How it works in the architecture:
- Total Instrumentation: It removes all filters from the Discovery Team software module, forcing it to report every action it takes.
- Significant Performance Overhead: Because the Agent must write so much data to its local database and then ship it to the Console, enabling this can slow down the actual scan and increase CPU/Disk usage on the endpoint.
- Console Saturation: The Logs tab in the Console will be flooded with technical data that is generally unreadable to anyone except a Spirion developer or a Senior Support Engineer.
- Recommendations:
- ⚠️ WARNING: Use only when requested by Spirion Support. You should never enable "Log Detailed Trace Messages" unless a Spirion engineer specifically asks for it to investigate a complex issue.
- Short-Duration Only: If you are instructed to use it, only keep it enabled long enough to reproduce the specific error you are troubleshooting (usually 5–10 minutes), then disable it immediately.
- Isolate the Agent: If possible, only enable this on 1 Search Agent and the 1 Discovery Agent involved in the test to minimize the impact on your Console and network.
- Log All Messages: This option is the absolute maximum verbosity setting for distributed scanning coordination. It is an "unfiltered" diagnostic mode that captures every internal event within the Discovery Team software module.
- This option for Discovery Teams is the "Total System Transparency" setting. It provides an exhaustive, unfiltered record of every internal and external action taken by the distributed scanning engine, making it the final-tier tool for diagnosing the most difficult and rare technical failures in Spirion's multi-agent architecture.
- While "Detailed Trace" focuses on the communication between agents, “Log All Trace Messages” captures both the external communication and the internal logic execution of the coordination engine on the local machine.
- Unfiltered Internal Audit: It logs every internal function call, variable state change, and logic branch taken by the Discovery Team coordinator or worker process.
- Exhaustive Protocol Logging: It records every byte of data exchanged between the Discovery Agent (the "Planner") and the Search Agents (the "Workers").
- Locking and Concurrency Details: It provides a minute-by-minute account of how the agent is "locking" work items in the distributed queue to ensure no other agent scans the same file.
- Maximum Data Generation: This is the "noisiest" setting in the entire platform. It can generate tens of thousands of log entries in a very short period, potentially creating gigabytes of log data if left on.
- Why it exists:
- This setting is a Developer-Level Diagnostic Tool used for the most complex architectural troubleshooting:
- Debugging "Deadlocks": If a Discovery Team completely stops moving but the processes are still running, this setting reveals if the internal threads are stuck waiting for a resource that never becomes available.
- Analyzing Race Conditions: It is used to solve rare "timing" bugs where two agents might attempt to claim the same work unit at the exact same microsecond.
- Deep Performance Profiling: Spirion Engineering uses these logs to see exactly how many milliseconds each step of the coordination process takes, helping them optimize the code for high-scale environments.
- How it works in the architecture:
- Total Transparency: It removes every diagnostic filter, forcing the Discovery Team module to "narrate" its entire internal life to the log file.
- High Resource Impact: This setting has a measurable impact on performance. The CPU must work harder to generate the logs, and the local Postgres
shipper_queuemust work significantly harder to transmit them to the Console. - Console Ingestion Load: Enabling this for multiple Agents can put a strain on the Console's Ingress server due to the sheer volume of incoming log packets.
- Recommendations:
- ⚠️ CRITICAL: Use only under Engineering supervision. You should never enable "Log All Trace Messages" unless you are working directly with a Spirion Support Engineer or Developer to solve a suspected product defect.
- Test Environment Only: It is strongly recommended to only use this setting in a lab or test environment, never on a production fleet of hundreds of agents.
- Disable Immediately: Once the specific behavior you are investigating has been captured, uncheck this box immediately to prevent your database and Console from being overwhelmed.