
How to Use Agent Logs
Overview
In Spirion Sensitive Data Platform, the Agent Log page is the "Technical Pulse" of your Spirion deployment. It provides the granular, machine-level evidence needed to ensure that your discovery and protection tasks are executing correctly, reliably, and across your entire intended scope.
The Agent Log page is the primary interface for monitoring the technical health and operational activity of your distributed Agents.
- The Audit Log tracks human actions in the console
- The Agent Log tracks machine actions on the endpoints
What the Agent Log Page Does
The Agent Log page provides a centralized view of the technical events generated by Spirion Agents as they execute their tasks.
- It acts as a "remote console" for the logs that are generated locally on each agent host, enabling administrators to troubleshoot issues without needing direct access to the endpoint's file system.
What Does the Agent Log Page Contain?
The Agent Log aggregates events from the 3 core functional roles of an Agent:
- Endpoint Service (EPS) Events:
- Registration & Heartbeats: Confirmation that the agent is successfully communicating with the console.
- Service Status: Start, stop, and restart events for the agent services.
- Connectivity Errors: Failures to reach the console or proxy issues.
- Discovery & Search (IDF/SystemSearch) Events:
- Scan Lifecycle: When a scan starts, pauses, resumes, or completes.
- Target Enumeration: Records of the agent connecting to specific targets (e.g., "Connected to File Share X").
- Access Denied/Errors: Specific files or directories that the agent could not scan due to permission issues or file locks.
- Match Summaries: High-level indicators that sensitive data was found (without revealing the raw data itself).
- Shipper (IFS) Events:
- Result Delivery: Confirmation that the results payload was successfully sent to the SaaS ingestion layer.
- Retry Loops: Records of the agent attempting to re-send results after a network interruption.
- Correlation IDs: Unique identifiers used to track a specific result set from the agent to the console.
What are Agent Logs Used For?
The Agent Log is the "first responder" tool for technical troubleshooting and operational oversight:
- Troubleshooting Scan Failures: If a scan is "Stuck" or "Failed," the Agent Log reveals the specific error (for example, "Invalid Credentials" or "Network Timeout").
- Verifying Coverage: Administrators use the logs to confirm that the Agent actually reached the intended targets and did not skip critical folders due to permission errors.
- Monitoring Performance: By reviewing start and end times in the logs, you can identify "long-running" scans that may need to be optimized or rescheduled.
- Confirming Remediation: When a playbook executes a "Shred" or "Quarantine" action, the Agent Log provides the technical confirmation that the local file system operation was successful.
- Health Checks: Agent logs are used to identify "Silent Failures"—Agents that are heartbeating but failing to execute their assigned search tasks.
Recommendations
- Filter by Time Window: When investigating an issue, always filter the Agent Log to the specific window (~10 minutes before and after the event) to avoid being overwhelmed by "noise."
- Look for "Access Denied": This is the most common cause of incomplete scans. Regularly search the Agent Log for this string to identify targets where the agent's service account needs elevated permissions.
- Check the Shipper Status: If you see findings on the agent but not in the console, check the IFS/Shipper logs in the Agent Log page. These logs tell you if the results are "stuck" in the local queue due to an outbound network block.
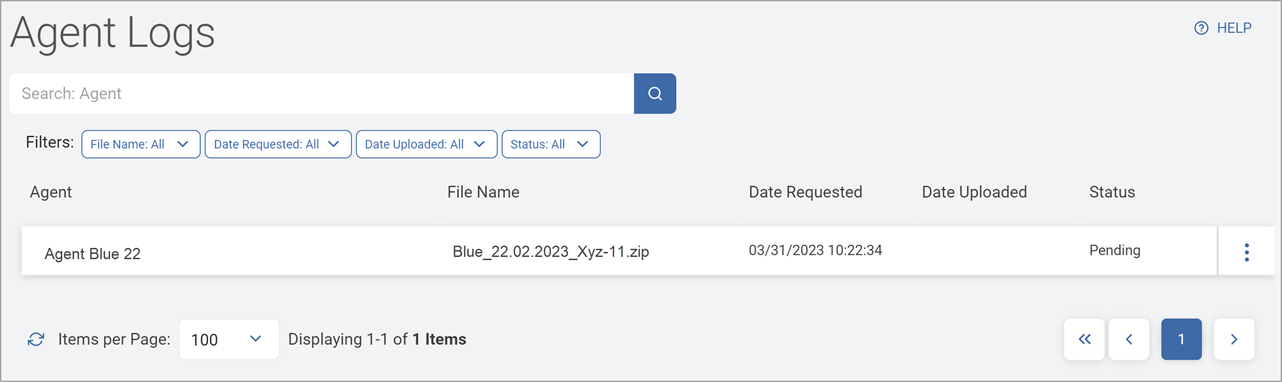
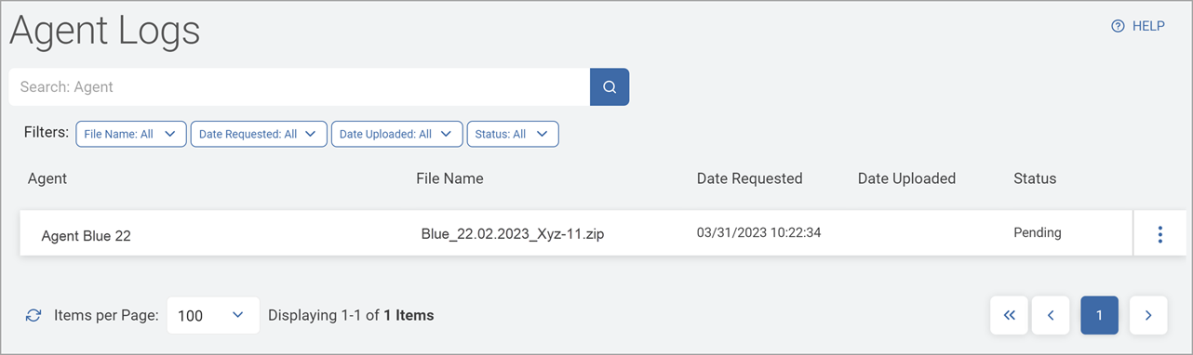
Agent Logs Table
The Agent Logs page displays the Agent logs collected via Gather Data requests in a table.
- You can search for a specific log and view upload counts.
How to Access and View Platform Logs
Procedure:
- From the left menu, click Reports.
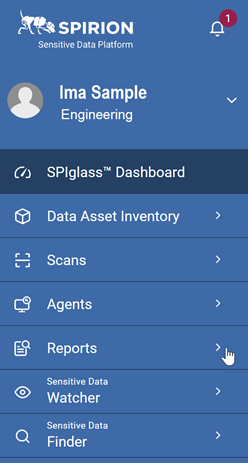
- Click Agent Logs.
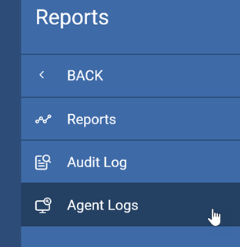
- The Agent Logs page appears.
Agent Log Table Columns
Agent Logs are displayed by the following columns.
Field | Description |
|---|---|
Agent | Name of the Agent |
File Name | The file name |
Date Requested | Date the Agent log was requested |
Date Uploaded | Date the Agent log was uploaded |
Status |
|
More Options menu (3 vertical dots) | Download Gather Data Delete Gather Data |
- You can filter the list by column(s) based on your business needs.
- Select one or more filters using the drop-down lists in the Filters section and enter your criteria.
- See How to Use Filters to Find Agent Logs below, for more information.
How to Search for an Agent Log
To search for an Agent Log:
- Type an Agent or File name in the search box.
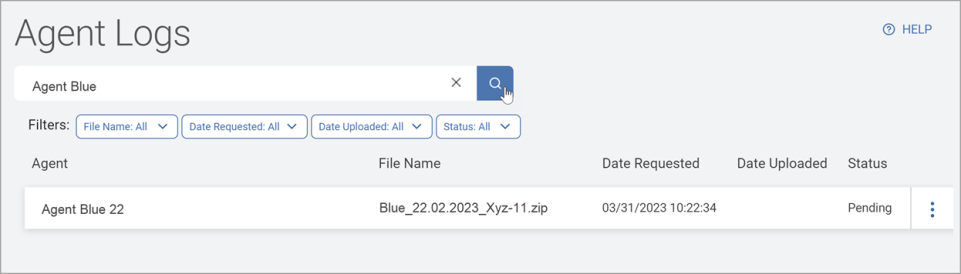
- Click the lens icon or Enter on your keyboard.
- The results are displayed in the list below.
- Click the x to clear the results.
How to Download Gather Data
To download the Gather Data zip file use the following steps:
- First, you must populate the Agent Logs page with Gather Data extracted from individual Agents.
- You can perform Gather Data requests on individual Agents listed on the Agent Management page (from the more options menu at the far right of the table).
- Once the Agent Logs page table is populated (there is a small delay between executing the Gather Data request and the entry appearing in the Agent Logs table), you can continue.
- For a specific entry click the more options menu in the far right column.
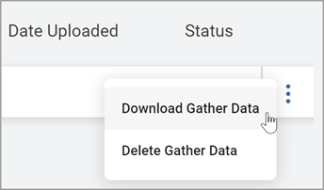
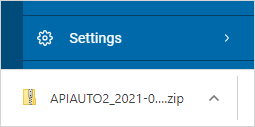
- Click Download Gather Data. The ZIP file is downloaded to your local computer.
Extract Gather Data to View Support and Diagnostic Information
Procedure:
- Once your Gather Data zip file is downloaded to your local machine, extract the contents.
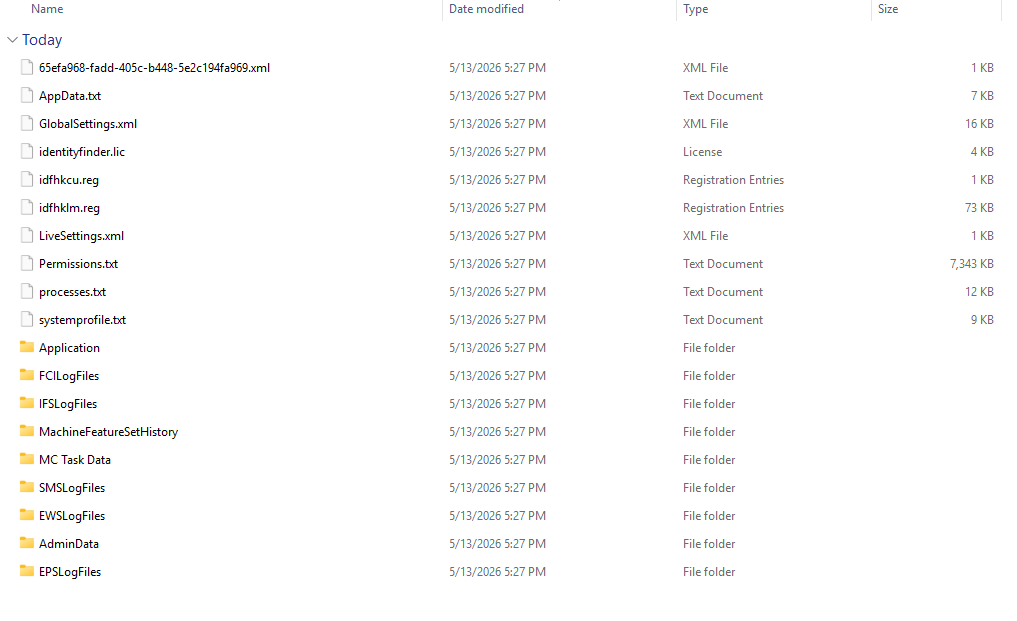
- The "Gather Data" zip file contains a comprehensive set of diagnostic information, configuration files, and logs from a Spirion Windows agent. This package is typically used by Spirion Support to troubleshoot Agent behavior, connectivity, and scan issues
Log Folders
- The Gather Data zip file contains several specialized log families:
- EPSLogFiles: Logs for the Endpoint Service, which handles Agent health, registration, and heart beats.
- IFSLogFiles: Logs for the Shipper process, which manages the delivery of scan results to the console.
- SMSLogFiles: Logs related to the System Management Service or search execution.
- EWSLogFiles: Logs for the Endpoint Watcher Service, which monitors Agent processes.
- FCILogLogFiles: Logs related to File Classification Infrastructure (if applicable).
Configuration and Environment Files
These files describe how the Agent is set up and the environment it is running in:
- GlobalSettings.xml and LiveSettings.xml: The active configuration and policy settings currently applied to the Agent.
- identityfinder.lic: The license file associated with the Agent.
- idfhkcu.reg and idfhklm.reg: Exports of the Spirion-related registry keys from HKEY_CURRENT_USER and HKEY_LOCAL_MACHINE.
- AppData.txt, processes.txt, and systemprofile.txt: Snapshots of the file system structure, currently running processes, and system environment variables.
- Permissions.txt: A report on the file system permissions for the Spirion installation and data directories.
Data & Task Folders
- Application: Typically contains the local databases (like analysis.db) that store search history and local results.
- MC Task Data: Information regarding tasks assigned to the agent from the Management Console.
- Admin Data & Machine Feature Set History: Metadata about the agent's administrative state and the features supported by the hardware/OS.
Summary of Use
This specific collection of files enables qualified personnel to see exactly what the Agent was doing (via logs), how it was told to do it (via XML settings and Registry files), and what might have stopped it (via permissions, process lists, and environment snapshots).
How to Delete Gather Data
To delete a Gather Data entry:
- Click the more options menu in the far right column.
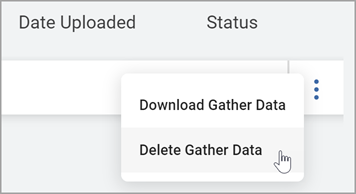
- Click Delete Gather Data.
Note: This action is immediate and cannot be undone.
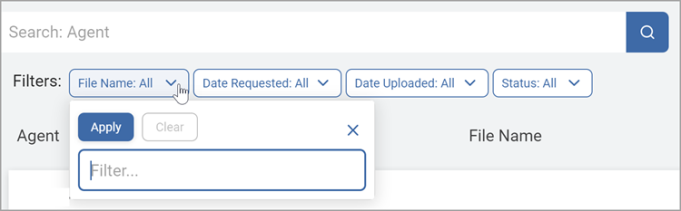
How to Use Filters to Find Agent Logs
To use the filter feature to find Audit Log based on specific criteria:
- In the upper left of the screen, go to the Filters .
For the below selection criteria, select one or more items from the drop-down list:
- File Name
- Date Requested
- Date Uploaded
- Status

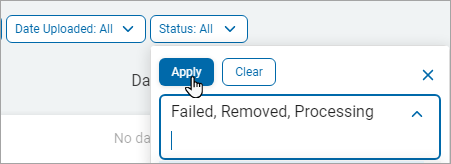
Procedure:
- Click the Apply button to apply the filter to the Agent Logs list.
- Click the Clear button and then click the Apply buttonto remove the filter.
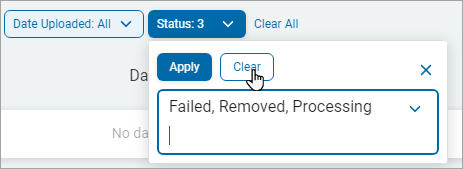
- Click Clear All link to remove all the set filters.