How to View and Use Scan Status
Scan Results Versus Scan Status
Do not confuse scan results with scan status.
Typically you start by viewing the status of a scan and then investigate ("drill-down") the scan's results, if the scan completed successfully,
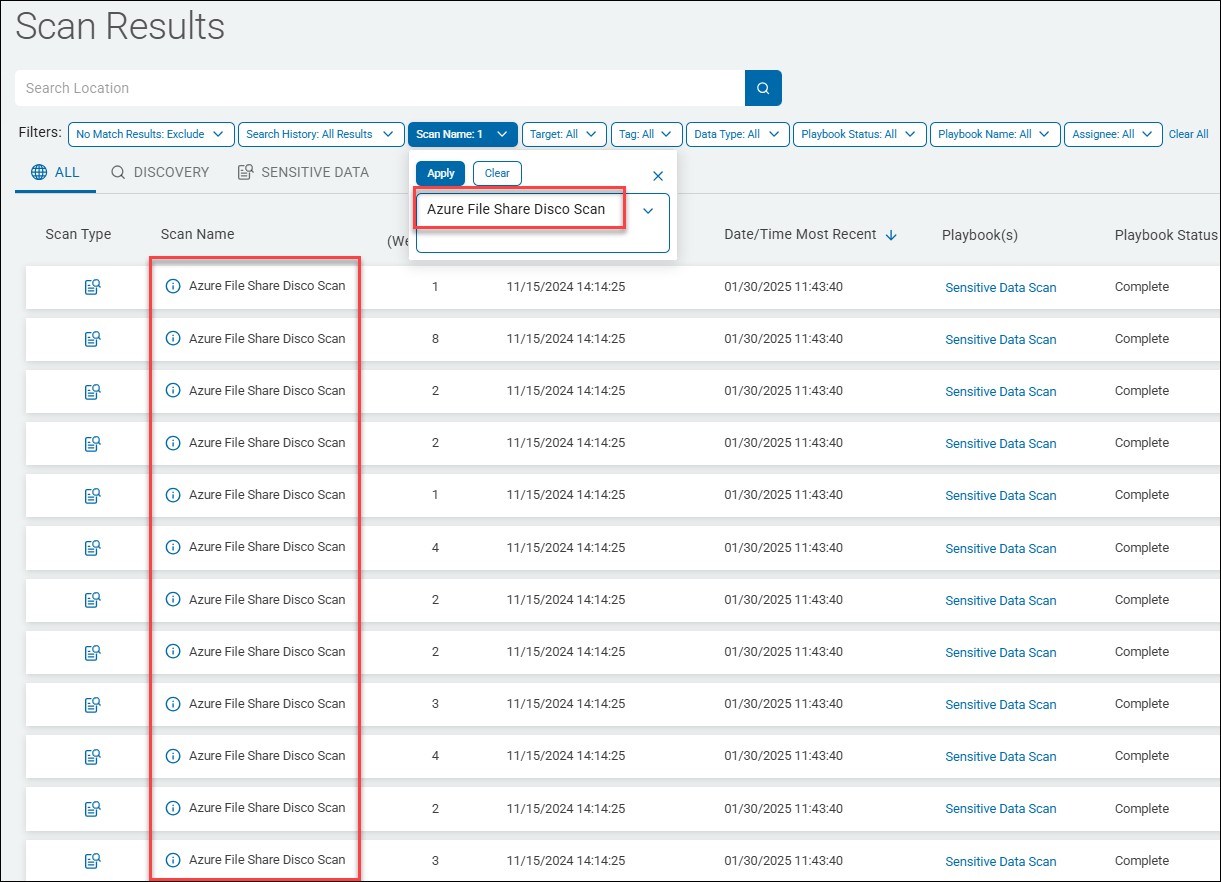
To view the scan results of a given scan you must go to the "Scan Results" page. You can navigate to the Scan Results page using the following steps:
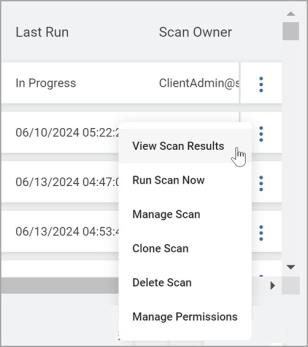
- From the All Scans page, locate the Scan you want to view.
- From the kebab menu, select View Scan Results.
- Alternatively, you can filter to a subset of matches from the Scan Results page.
- Alternatively, you can filter to a subset of matches from the Scan Results page.
- Itemization by location is confirmed by the following:
- Total Match Count listed at the top-right of the screen, next to the Actions button.
- Clicking this toggles to results itemized by match.
- The Location column has an expansion icon:
- Clicking this icon opens the ULR modal including match data.
Note: For database Targets, the column name is in the match info tool tip, accessed by clicking the i next to a match.
- Clicking this icon opens the ULR modal including match data.
- The URL of a location-based results table ends in “/scans/results”
- The URL of a match-based results table ends in “/scans/results-alt”
- As noted above, clicking the "Total Match Count" button lists results itemized by match.
- There is also a View Scan Results by Match option accessible from the Actions button.
- Returning to Results by Location:
- From the Actions button, select View Scan Results by Location.
Definitions and Use of the Scan Status Column
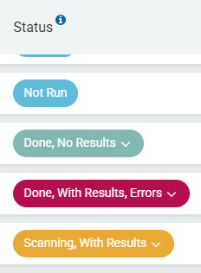
These status values provide a quick health check of your scan jobs.
They combine the execution state (is it running?) with the outcome (did it find anything or fail?).
Note: You can filter the Status column by entering the term ("Scanning," "Done," "With Results," "Errors," etc.) in the search field at the top of the page.
Here is the breakdown of what each status value means:
Active Scan States (In Progress)
- Scanning: The scan is currently active. Agents are either enumerating the Target (Discovery) or inspecting files (Search). No sensitive data matches have been reported to the console yet.
- Scanning, With Results: The scan is currently active, and the Agents have already identified and reported at least one sensitive data match to the console. You can begin reviewing these findings on the Scan Results page even before the scan finishes.
Completed Scan States (Finished)
- Done, With Results: The scan has finished successfully across all assigned Agents. Sensitive data matches were found and are available for review. This is the "standard" successful outcome for a scan where data was expected.
- Done, With Results, Errors: The scan has finished and found sensitive data, but one or more Agents encountered issues.
- Note: This usually means the Agent couldn't access certain files (for example, "Access Denied"), a network timeout occurred, or a specific database table was locked. Check the Scan Status pop-up to see which locations failed.
- Done, No Results: The scan finished successfully, but no sensitive data matching your Scan Playbook criteria was found.
- Operational Tip: If you expected to find data, verify that your Scan Playbook is correctly configured and that the Agent has the necessary permissions to read the file contents.
Inactive Scan States
- Not Run: The scan configuration has been created and saved, but it has never been executed—either manually or via a schedule. It is essentially a "draft" or a newly created policy waiting for its first run.
Summary Table for Quick Reference
Status | Is it finished? | Did it find data? | Were there issues? |
|---|---|---|---|
Scanning | No | Not yet | -- |
Scanning, With Results | No | Yes | -- |
Done, With Results | Yes | Yes | No |
Done, With Results, Errors | Yes | Yes | Yes |
Done, No Results | Yes | No | No |
Not Run | -- | -- | -- |
Troubleshooting Tip: If you see a status of "Done, No Results" on a scan that took 0 seconds to run, it typically means the Agent couldn't find the target path at all (for example, a mapped drive that isn't connected). Always check the Total Locations count in the Scan Status pop-up to ensure the Agent actually looked at the files you intended.
How to Use Scan Status
The scan Status column is used for a number of purposes, including monitoring, maintenance, and troubleshooting.
The specific tasks you perform with Scan Status are as follows:
- Monitor the status of scans (active/inactive/hung etc.)
- Resolve failed or hung scans
- Investigate the details of each scan to identify and resolve any errors that have occurred
- Identify problem Agents
- Ensure scan performance - that scans are performed by assigned Agents in a timely fashion
For more information see "Why does a scan hang or fail to complete?"
How to View the Detailed Status of a Scan
Use the following steps to view the details of a scan:
- From the Status column, click the drop-down list of the scan you want to view.
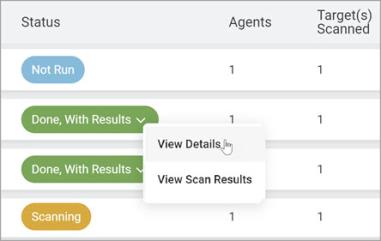
- Click View Details from the sub-menu that appears.
- The Scan Details pop-up window opens. See the example screenshot below:
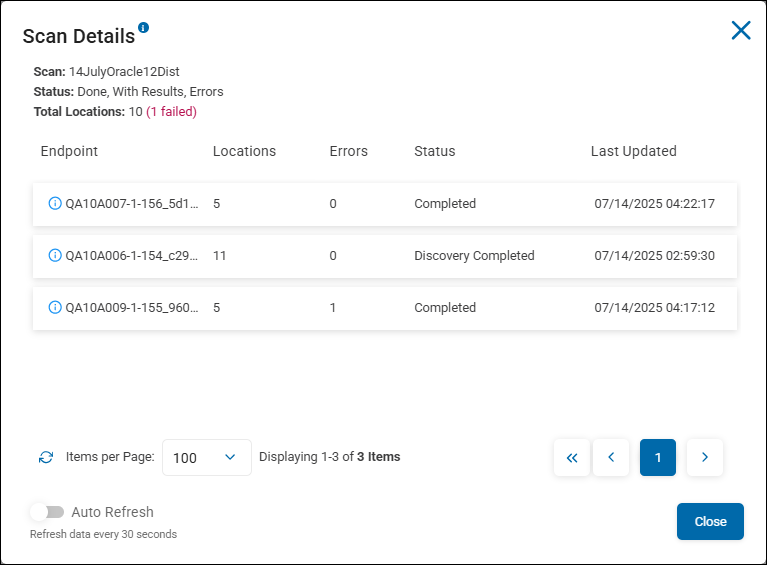
Scan Details Pop-up Window
The "Scan Details" pop-up window displays details about each endpoint (Agent) involved in the scan and the work it performed during the scan.
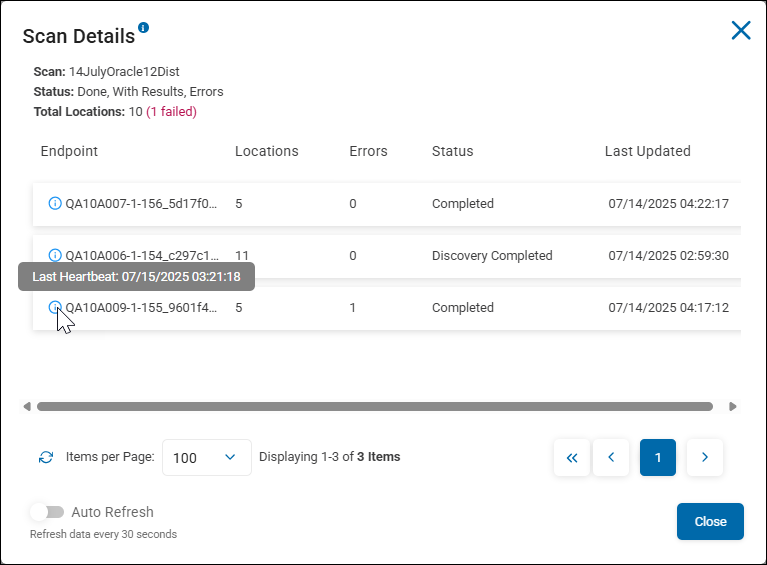
Header Information
- Scan: The user-defined name of the scan configuration (in this case, "14JulyOracle12Dist").
- Status: The overall state of the scan. "Done, With Results, Errors" means the job is finished, sensitive data was found, but at least one error occurred during processing.
- Total Locations: A summary of the scan scope.
- 10 (1 failed) indicates that 10 files, records, or objects (for example, database tables or folders) were targeted, but 1 could not be processed.
Endpoint Results Table
This table breaks down the work performed by each individual Endpoint (Agent) assigned to the scan. Each row represents one Agent/endpoint that participated in the scan.
- Endpoint: The name of the specific machine (Agent) that performed the work in FQDN or hostname format.
- Locations: The number of data locations (files, database records, mail items, etc.) processed by that specific Agent.
- Errors: The count of issues encountered by that specific Agent.
- Status: The current state of that specific Agent's task.
- Discovery Completed: The Agent has finished mapping out the Target (common in distributed scans) - locating and indexing data locations.
- Completed: The Agent has finished its assigned search tasks.
- Last Updated: The timestamp of the last communication from the Agent regarding this specific scan formatted as
MM/DD/YYYY HH:MM:SS: - This enables administrators to verify recency of reporting and identify endpoints that may have gone silent or stalled.
Last Heartbeat tooltip
The ⓘ icon on each endpoint row displays the Last Heartbeat timestamp — the most recent time that scanning Agent communicated back to the system.
Auto Refresh toggle
- When enabled, the modal automatically polls for updated scan data at a fixed interval.
- Refresh data every 30 seconds - The label beneath the toggle confirms the polling interval when Auto Refresh is active.
- This is particularly useful when monitoring an in-progress scan in real time, allowing administrators to watch endpoint statuses update without manually refreshing.
Scan Details Examples
Distribtued Scan Completed with Results and Errors
The Scan Details example above shows a detailed breakdown of a completed distributed scan performed by 3 Endpoints (Agents) on 11 locations (files or emails) on July 14, 2025.
High-Level Scan Summary
- Scan: User-defined name of scan. In this example,
14JulyOracle12Dist. - Status:
Done, With Results, Errors— This indicates the scan finished and found sensitive data, but also encountered at least 1 issue. - Total Locations:
10 (1 failed)— Out of the 10 targeted locations, 1 could not be successfully scanned.
Agent (Endpoint) Breakdown
The performance and status of the 3 Agents assigned to this scan are as follows:
- QA10A009-1-155...
- Locations: 5
- Errors: 1
- Status:
Completed - Last Updated: 07/14/2025 04:17:12
- Description: This Agent is responsible for the "1 failed" location mentioned in the summary, above. The last communication from this Agent regarding this scan was July 14th, 2025 at 4:17 a.m..
- QA10A007-1-156...
- Locations: 5
- Errors: 0
- Status:
Completed - Last Updated: 07/14/2025 04:22:17
- Description: This Agent discovered 5 locations (files, emails, database records, etc.) which contained sensitive data. 8 errors occurred. The last communication from this Agent regarding this scan was July 14th, 2025 at 4:22 a.m..
- QA10A006-1-154...
- Locations: 11
- Errors: 0
- Status:
Discovery Completed - Last Updated: 07/14/2025 02:59:30
- Description: This Agent acted as the Discovery Agent for this distributed Oracle scan. It performed the initial enumeration of the database tables/columns (11 locations) before the other Agents began their search tasks. The last communication from this Agent regarding this scan was July 14th, 2025 at 2:59 a.m..
Last Heartbeat tooltip
The ⓘ icon on each endpoint row displays the Last Heartbeat timestamp — the most recent time that scanning agent communicated back to the system.
A tooltip is actively displayed on the third row — the endpoint beginning with QA10A009-1-155_9601f4... — triggered by hovering over its blue ⓘ icon.
The tooltip displays:
Last Heartbeat: 07/15/2025 03:21:18
For this endpoint, the last heartbeat was July 15, 2025 at 03:21:18, which is approximately 23 hours after its Last Updated (scan activity) timestamp of 07/14/2025 04:17:12 — indicating the Agent remained active well after the scan completed.
Operational Context
- Timestamps: The scan took place on July 14, 2025, between approximately 03:00 and 04:22.
- Troubleshooting: To investigate the single error on Agent
QA10A009, an administrator would typically check the Status logs or Scan Results page (Scans > Scan Results) to see the specific error message (for example, a specific database table that was locked or inaccessible).
Distribtued Scan Completed with Results and Many Errors
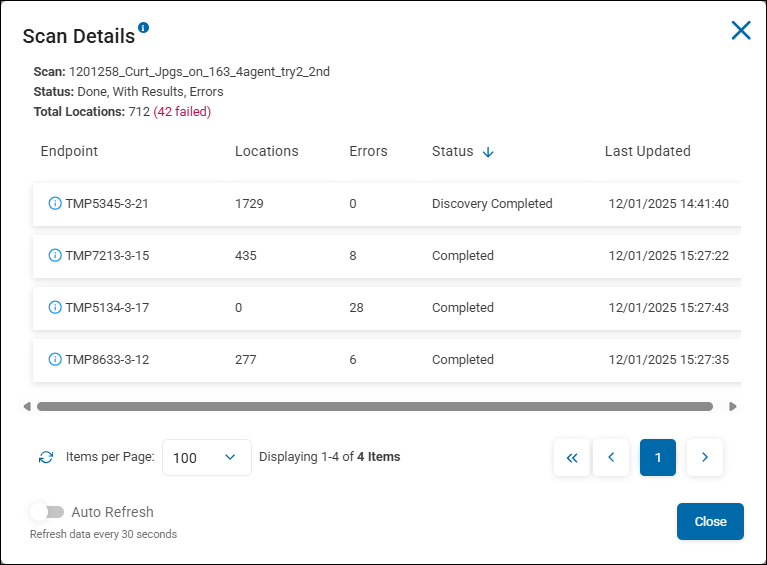
This Scan Status example above shows a detailed breakdown of a completed distributed scan performed by 4 Endpoints (Agents) on 1729 locations (files or emails) on December 1, 2025.
High-Level Scan Summary
- Scan:
1201258_Curt_Jpgs_on_163_4agent_try2_2nd - Status:
Done, With Results, Errors— This indicates the scan finished and found sensitive data, but also encountered some issues (likely permission or file access errors). - Total Locations:
712total locations were targeted, with42 failed.
Agent (Endpoint) Breakdown
The performance and status of the 4 Agents assigned to this scan are as follows:
- TMP5345-3-21:
- Locations: 1729
- Errors: 0
- Status:
Discovery Completed - Description: This Agent acted as the Discovery Agent for the distributed scan; it has a significantly higher location count and a specific "Discovery Completed" status. Recall, Discovery Agents scan for metadata only. They mark servers, databases, workstations, Email servers, etc. for follow-up Agents to scan for sensitive data. The last communication from this Agent regarding this scan was December 1st, 2025 at 2:41 p.m..
- TMP7213-3-15:
- Locations: 435
- Errors: 8
- Status:
Completed - Description: This Agent discovered 435 locations (files or emails) which contained sensitive data. 8 errors occurred. The last communication from this Agent regarding this scan was December 1st, 2025 at 3:27 p.m..
- TMP5134-3-17:
- Locations: 0
- Errors: 28
- Status:
Completed - Description: This Agent failed to scan any locations successfully, as evidenced by the 0 locations and 28 errors. This often indicates a credential or network path issue specific to this Agent's perspective of the Target. The last communication from this Agent regarding this scan was December 1st, 2025 at 3:27 p.m..
- TMP8633-3-12:
- Locations: 277
- Errors: 6
- Status:
Completed - Description: This Agent discovered 277 locations (files or emails) which contained sensitive data. 6 errors occurred. The last communication from this Agent regarding this scan was December 1st, 2025 at 3:27 p.m..
Operational Context
- Timestamps: All Agents completed their work on 12/01/2025 between 14:41 and 15:27.
- Troubleshooting: To investigate the "42 failed" locations or the 28 errors on Agent
TMP5134-3-17, an administrator would typically view the Results or Status logs to see the specific error messages (for example, "Access Denied" or "File Not Found").
How to View Scan Results
After a scan is complete, the sensitive data captured by the scan is available.
- To fully realize the value of Spirion Sensitive Data Platform, it is imperative that you ensure the sensitive data discovered by scans is addressed quickly and appropriately
- To investigate sensitive data and the actions that are or are not being performed on it, the All Scans page is a great place to start.
- Remember, users typically choose a method of remediating sensitive data that is iterative.
- First, scan and capture your sensitive data with few actions
- Next, classify the scanned sensitive data
- Next, notify users and request they take action (classify, shred, redact, etc.)
- Next, examine the actions taken on sensitive data by expert users and automate these actions
- At each phase, Spirion Sensitive Dashboards reveal how much exposed sensitive data is being properly managed and remediated over time
Use the following steps to view the results of a scan:
- From the left side navigation menu select Scans > All Scans.
- The Scans page opens.
- Scan are shown in a table with 3 available tabs:
- ALL - This tab contains both Discovery and Sensitive Data scans.
- DISCOVERY SCANS - This tab contains only Discovery scans (metadata only)
- SENSITIVE DATA - This tab contains only Sensitive Data scans
- Locate the scan you want to examine.
- For the target scan, under the "Status" column perform the following steps:
- Click the drop-down menu of the scan completion status (must be "Done, with Results," or "Done, With Results, Errors")
- Select View Scan Results.
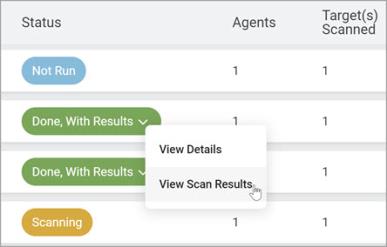
- The Scan Results page opens with the filter "Scan Name" at the top of the page selected and applied for the scan selected on the Scans page.
- The table on the page displays only the results of the scan you selected.
- From here, investigate the status of your sensitive data by location (file or email which contains sensitive data matches, including path)
- Scroll to the right to the Locations column
- Click the opposing arrows icon:
Alternatively, click the More Options menu at the end of the row, and select View Matches.
- The "Location Details" pop-up window opens with various information about the Location selected.
- For details about the Location Details window and how to take remediation actions on the sensntive data matches shown, see How to Perform Location and Match Actions on Scan Results.