
Introduction to Spirion Sensitive Data Platform v13.6
Section 1: What Spirion Sensitive Data Platform (SDP) is - and why it exists
Spirion Sensitive Data Platform is a platform for discovering and understanding where sensitive data lives across your environment—so you can reduce risk with facts instead of guesses.
It exists because in real organizations the following is true:
- Sensitive data spreads across endpoints, shares, email, SaaS apps, and databases
- Ownership is unclear (“who is responsible for that folder?”)
- One-time scans don’t scale
- “we’ll clean it up later” never happens without visibility and repeatability
Spirion Sensitive Data Platform gives you that repeatability: define what matters → scan at scale → review findings → take action → prove progress.
3 Things to Recognize Immediately
When you first see Spirion, everything becomes easier if you lock onto these three concepts:
1. The Console (the control plane)
The console is where you, the operator works.
You perform functions such as the following:
- Define “what to find” (policies / data types / rules)
- Define “where to look” (targets / scopes)
- Run and schedule scans
- View findings, dashboards, and reports
Think of the console as mission control: configuration, visibility, orchestration.
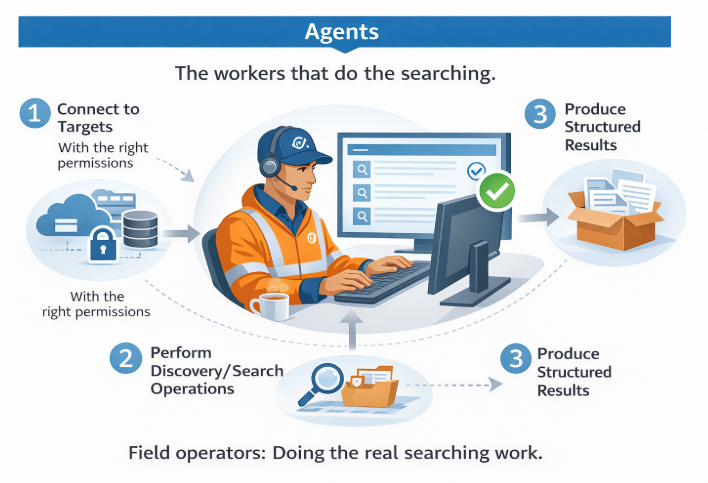
2. Search Agents (the workers that do the searching)
Agents run where the data access happens (often near or on the systems being searched). Agents are responsible for:
- Connecting to targets (with the right permissions)
- Performing discovery/search operations
- Producing results in a structured way
Think of Agents as field operators: they do the real searching work.
3. End-to-End Pipeline (how work becomes results)
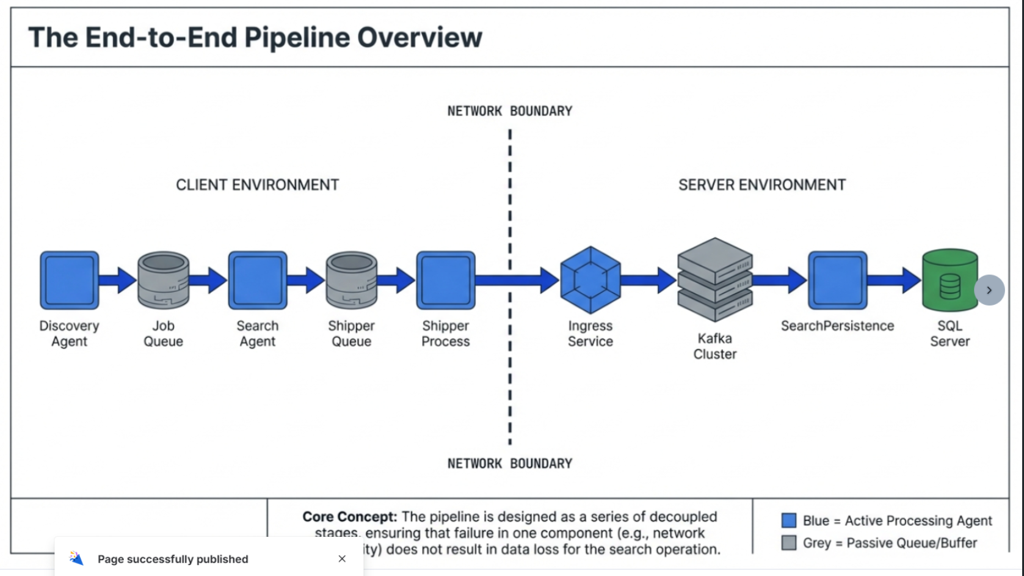
A scan is not “one thing.”
It is a chain of decoupled stages that keeps the system resilient and scalable.
Use this mental model:
The console requests work → agents perform work → results are shipped → platform ingests → data is stored → reporting becomes possible.
How the Pipeline Works
Read the diagram from left to right. The key idea is that this pipeline is built from separate stages so that temporary problems (like network hiccups) don’t automatically mean “scan is lost” or “results disappear.”
Client-side (your environment / where agents run)
Discovery Agent
- Receives scan work
- Connects to the target and enumerates its contents
- Coordinates what needs to be searched
Job Queue
- Holds “units of work” so the agent can process reliably
- Helps with throttling and retry behavior when needed
Search Agent
- performs the actual search operations against the configured targets
Shipper Queue + Shipper Process
- Packages results and sends them onward
- Critically: this separation helps prevent a transient network outage from forcing the scan to restart from scratch
Network boundary (important for troubleshooting)
The diagram shows a network boundary between your environment and the server-side services.
- This is where many real-world issues show up (proxy, TLS inspection, firewall rules, DNS, routing).
- Keeping this boundary visible helps you reason about “where the failure likely is.”
Server-side (Spirion SaaS services specifically involved in this pipeline)
Ingress Service
- Receives shipped results safely and consistently
Kafka Cluster (stream/buffer)
- Provides durable buffering and scalable ingestion
SearchPersistence
- Transforms/organizes results for storage
SQL Server
- Long-term persistence for search results and reporting
What “normal” looks like in one sentence:
Agents steadily process work and ship results; the platform ingests them continuously; the console shows findings shortly after scanning progresses.
What kinds of things can Spirion scan? (Targets, at a beginner level)
At a high level, Spirion scans “places where sensitive data hides.” In beginner language, think in target categories:
- Endpoints
- Windows / macOS systems where users create and store documents locally
- File storage
- file shares and managed storage locations where documents accumulate over time
- Email systems
- mailboxes and message stores (where regulated data often lives for years)
- Cloud / SaaS storage
- common collaboration repositories where sensitive data gets copied and reshared
- Databases
- structured systems that may contain PII/PHI/PCI and secrets
In this overview, you don’t need to memorize every connector type—just remember: SDP can authenticate to many target categories, and agents/connector logic do the work of accessing and searching those sources safely.
Section 2 — Tour of the Console (Your Mission Control)
What this section is
This is a guided “first look” at the Spirion SaaS console so a beginner can answer:
- What am I looking at?
- Where do I go to do the important things?
- What should I ignore for now?
- How do I prove the system is healthy (at a high level)?
Success criteria: after this section, you can navigate confidently and narrate the console in a way that matches the end-to-end pipeline from Section 1.
What the Console is (definition + why it exists)
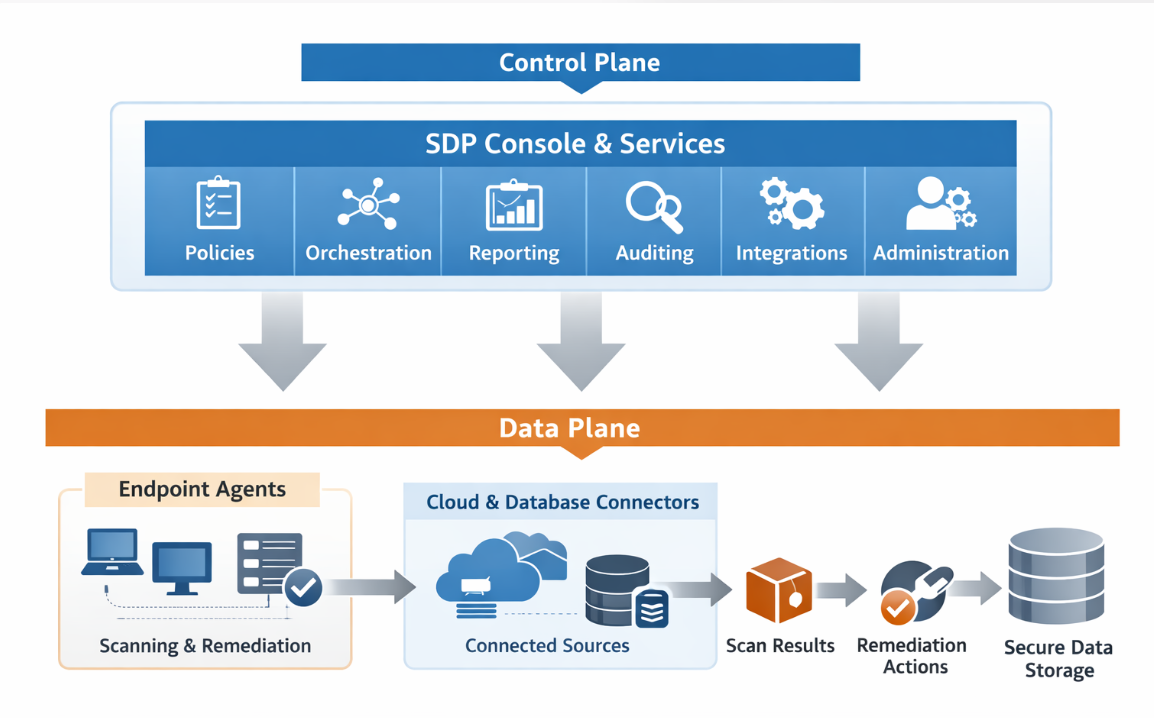
The Console is Spirion SDP’s control plane. It exists to give you one place to:
- configure discovery behavior (“what to find”)
- define scope (“where to look”)
- manage the worker fleet (agents/connectors)
- run scans and monitor progress
- review results and generate reporting
In a single sentence: the console is where you design and supervise work; agents perform it; the pipeline delivers results back here.
What the console provides
- a consistent configuration source of truth
- repeatable scan definitions and scheduling
- monitoring and auditability
- a shared place for findings, remediation actions available or taken, and reporting
How the Console is organized (a mental map)
Even if the labels vary slightly between versions/roles, most consoles cluster into the same “zones.” When you log in, look for these categories:
1) Home / Overview (orientation + “what’s happening”)
What it is
A landing area with high-level status and shortcuts.
What to look for (beginner signals)
- recent activity (latest scans or jobs)
- “agent health / connectivity” indicators if present
- high-level finding counts/trends (don’t over-interpret yet)
Common gotcha
It’s easy to treat the landing page as “truth.” Don’t. It’s a summary. Use it to navigate, not to diagnose.
2) Scans / Jobs (where work is launched and monitored)
What it is
The place you start work (“run a scan”) and watch it progress.
How it fits the pipeline
A “scan” in the console becomes queued work for agents (client side), then shipped/ingested back into platform storage.
What “normal” looks like
- Scan start time
- Current stage/progress indicators (even if coarse)
- Completion or error state
For a beginner, “normal” simply means: a scan transitions out of ‘starting’ and produces visible progress or results.
Common misunderstandings
- Confusing “configured scan definition” vs “scan run/job instance.”
Section 3 — Agents 101 (The Workers That Make Scans Happen)
What this section is
This section explains what Spirion “Agents” are, how they participate in the end-to-end pipeline, what “healthy” looks like, and what evidence to collect when something’s off.
Success criteria: after this section, you can describe (at a high level) how agents receive work, perform discovery/search, ship results to SaaS, and where to grab the first set of logs when troubleshooting.
What an Agent is (definition + why it exists)
A Spirion Agent is the software component that runs in (or near) your environment and performs the actual sensitive-data work that the console orchestrates.
Agents exist because the console can’t “reach into” every private network, endpoint, or data source directly. Instead:
- the console defines and schedules work
- the agent executes work where access to data is possible
- the pipeline ships results back to the Spirion SaaS services for reporting and governance
What problem agents solve
Agents solve the practical barriers that stop discovery projects from scaling:
- Network boundaries: many targets live behind firewalls/VPN/proxies.
- Authentication realities: agents can use approved credentials and permissions close to the data.
- Performance and resilience: work is queued and processed in stages so transient failures don’t destroy progress.
- Operational consistency: standardized execution plus standardized logs and evidence for troubleshooting.
How Agents work (mapped to the pipeline you saw)
Even though people say “the agent,” it’s helpful to think in three functional roles, which often show up as separate processes and log families:
1) Endpoint Service (EPS) — the “always-on” agent service
What it does
- Runs as a service
- Maintains registration/heartbeat with the console
- Helps coordinate execution and local health
What “normal” looks like
- Agent is visible in the console
- “Last seen/heartbeat” updates regularly
- No persistent service errors
2) SystemSearch / IDF — the discovery + search engine
What it does
- Discovery: enumerates what should be scanned and creates work units
- Search: claims work units and performs the actual scanning/classification/actions
What “normal” looks like
- When a scan runs, you see search activity in agent-side logs
- Progress moves from “starting” → “in progress” → “complete” (even for a tiny pilot)
3) Shipper / IFS — result delivery to Spirion SaaS
What it does
- Packages findings/results and ships them across the network boundary to SaaS ingestion
What “normal” looks like
- Results leave the endpoint and appear in the console within a reasonable time window
- If the network hiccups, shipping retries rather than silently losing data
Customer control and data boundaries (SaaS trust model)
A common beginner question is: “If Spirion is SaaS, does that mean Spirion can see all our data?”
The correct model is as follows:
Agents run under end-user control
Scanning and analysis happen inside the customer environment, on machines you, the operator, controls (endpoints/servers/VMs managed under your security program).
The end user controls the following:
- Host hardening, patching, EDR, and local access
- Network egress rules (firewall/proxy/VPN)
- Which credentials are used to access targets
- What is scanned (scope) and what actions are allowed (policy/remediation)
Plain-English version to reuse in onboarding:
“The agent does the scanning inside your environment. We don’t pull your files into SaaS to scan them.”
Only results are shipped to SaaS (not source repositories)
What stays customer-side:
- Original files/content being scanned
- Raw target repositories (documents, email bodies, DB tables, etc.)
- Credentials used for scanning
What is shipped to SaaS:
- Findings metadata (what was found, where, what type, timestamps, etc.)
- Scan/job status needed for tracking and reporting
- Optional match evidence/snippets (based on customer configuration)
Encrypted transport and protected storage (high level)
Results are transmitted from agent → Spirion SaaS encrypted in transit.
- Results are stored on the SaaS side in the platform’s protected persistence layer (protected at rest).
(We’ll go deeper on network/proxy/TLS inspection “gotchas” later in troubleshooting.)
Optional pre-shipping redaction (agent-side masking)
Spirion can optionally be configured so that match data is partially redacted by the agent before anything is sent to SaaS.
What this means:
- the agent finds a sensitive value (e.g., an identifier)
- before shipping, the agent can mask part of that value
- the console displays only the permitted portion plus masking characters
What Agents can do (the exciting part)
Agents don’t just “find.” They can also take actions based on policy and workflow design.
At a high level, agent-driven outcomes include:
- Find / classify sensitive data (PII/PHI/PCI, secrets, custom patterns, etc.)
- Remediate (when configured), such as:
- safe actions: notify, tag/label (where supported), restrict/remove exposure patterns (target-dependent)
- strong actions: quarantine/move, encrypt, redact, delete (use with care; typically gated by policy + permissions + process)
We’ll cover remediation in a dedicated section later with a “safe-first ladder” and clear caveats—this is just the anchor: Spirion = discovery + action + proof.
Agent lifecycle (from “installed” to “productive”)
1) Registration (how the console and agent trust each other)
What it is
- You download an agent installer and a small registration/config artifact from the console.
- Installing/using that artifact tells the agent which SaaS tenant/console to report to.
What “normal” looks like
- Shortly after installation + registration, the agent appears in the console and begins heartbeating.
2) Agent assignment and how work distributes (Discovery vs Search)
Agent(s) are assigned during the progressive scan creation process in the Spirion Console (as you define what to scan and where to scan, you’ll select/attach one or more agents that are eligible to execute that work).
From an execution standpoint, it helps to understand that every scan typically breaks into two roles:
- Discovery role: enumerate scope, create units of work (what to scan next)
- Search role: perform the actual content inspection/classification (execute the work)
Note on terminology (linking this to the pipeline diagram): in the end-to-end pipeline diagram these appear as “Discovery Agent” and “Search Agent.” In practice, those roles may run on the same agent (as threads within one process) when you assign only one agent.
Single-Agent Scan behavior
If you assign a single Agent, that one Agent performs both discovery and search for the scan.
Practically: it does this concurrently as two threads inside the same IdentityFinderCMD.exe process:
- A Discovery thread (builds/feeds the work)
- A Search thread (consumes/executes the work)
The scan starts, discovery begins enumerating, and search begins processing as soon as work items become available.
You’ll often see the scan progress even while discovery is still running (because search doesn’t need to wait for discovery to finish everything).
Distributed behavior for scans (that are not local scans)
For any scan other than a local scan, Spirion distributes the workload conceptually like this:
- Exactly 1 Discovery Agent
- Owns enumeration and work creation for the scan scope
- 1 or more Search Agents
- Pull/receive work items and perform the actual search/classification
This is the model that enables scale: discovery stays coordinated (one “planner”), while search fans out (many “workers”).
You’ll see one agent acting as the coordinator (discovery-heavy activity), while other agents show more sustained search execution.
Adding more search agents generally increases throughput (up to the limits of the target, network, and any throttling).
Operational gotcha to watch for
If discovery is healthy but search agents are missing access/permissions, you can end up with “planned work” that can’t be executed. The fix is usually permissions/placement, not “more agents.”
Multiple Agent Local scan behavior (important exception)
A local scan is different.
If you assign more than one Agent to a local scan:
- Each assigned Agent executes the same local scan on its own machine
- Each endpoint runs both:
- Its own Discovery thread (for its own local scope)
- Its own Search thread
- Results are not merged at the endpoint; they are accumulated at the end of the pipeline as separate endpoint scan results
What this means in plain English
Assigning multiple Agents to a local scan does not split one machine’s work across Agents.
It performs the scan “in parallel” across multiple endpoints—because each agent is scanning its own local system.
You’ll see findings roll up as results from multiple endpoints, each representing that endpoint’s local data.
If you intended “one endpoint only,” assign only the Agent installed on that endpoint.
Practical guidance (how to choose)
- For a first pilot: assign 1 agent and keep the scope small (fast feedback, simpler troubleshooting).
- For non-local scans at scale: use 1 discovery agent + multiple search agents (fan-out).
- For local scans across many endpoints: assign multiple agents intentionally, knowing each one runs the same designated local scan on its own host.
3) Execution (discovery/search runs)
A scan becomes queued work; the search engine claims work and processes it.
What “normal” looks like
Jobs progress; you can see timestamps moving in the scan/job view.
4) Shipping + Ingestion (results appear in console)
Results are staged locally, then shipped to SaaS, then ingested and persisted.
What “normal” looks like
Findings appear in the console soon after the scan begins producing results.
Health checklist (beginner “pre-flight”)
Use this checklist before you assume “Spirion is broken”:
Pre-flight: agent is alive
- Agent shows up in the console
- “Last seen / heartbeat” is recent
- Agent is not disabled / in an error state
Pre-flight: agent can reach SaaS
- No known proxy/VPN restrictions blocking outbound connectivity
- DNS resolution works consistently
- TLS inspection/proxy behavior is understood (common enterprise gotcha)
Pre-flight: agent has access to the target you want to scan
- Correct credentials/permissions exist (target-dependent)
- Agent has the appropriate network access
Logs and evidence (what to collect every time)
When anything “Agent-related” is being investigated, you want to look first at:
The appropriate time window
- ~10 minutes before the issue → through failure → ~10 minutes after
- Ensure you account for timezone
Find Specific Identifiers
- Agent identifier / hostname
- OS + agent version
- Scan/job identifier (or the exact scan name + start time)
- Target name/type
Log families
These are the three you’ll hear repeatedly:
- EPS logs — Endpoint Service (agent health/registration/heartbeat)
- IDF / SystemSearch logs — discovery + scanning activity
- IFS logs — shipper activity (result delivery)
Where the logs live (Windows guidance)
Typical log directory on Windows agents (varies by build/version):
%ProgramData%\Identity Finder\Logs\
For macOS/Linux, paths can vary by version and packaging. The reliable operational approach is:
- Identify the Agent service/process names on that host
- Locate the configured log directory for that build
- Bundle EPS/IDF/IFS equivalents for the same time window
High-signal markers to search for (quick triage)
- In EPS: registration/heartbeat messages, service start/stop, connectivity errors
- In IDF/SystemSearch: scan start, target enumeration, access denied, retry loops, completion markers
- In IFS/Shipper: outbound send attempts, success (200-class), retry/failed status, correlation IDs
Section 4 — Targets & Authentication Overview (Where Spirion Can Look)
What this section is
This section is the “wow, that’s a lot of coverage” moment.
You already understand:
- The Console is mission control
- Agents do the scanning inside your environment
- The Pipeline ships results to SaaS/Console Resources
Now we answer the next beginner question:
“Where can Spirion actually scan?” (and at a very high level, how it gains access).
What a “Target” is (definition + why it exists)
A target is any system or repository where data lives that Spirion can authenticate to and scan.
Targets exist because discovery is only useful when it’s:
- Repeatable (you can scan again next week/month)
- Scoped (you know exactly what you searched)
- Auditable (you can prove what was scanned and when)
The big idea: Spirion scans “where sensitive data hides”
Sensitive data rarely lives in just one place. It tends to spread across:
- Things people create (endpoints)
- Places teams collaborate (file shares + cloud storage)
- Places people communicate (email)
- Places systems store records (databases)
- “Everything else” that’s still business-critical (SaaS apps)
Spirion is built for that reality.
Target categories (breadth-first, beginner-friendly)
Workstations and Servers
These are where sensitive data often starts:
- Downloaded reports
- Exported spreadsheets
- “temporary” files that become permanent
- Screenshots, PDFs, and cached data
Why this matters: these are usually the fastest way to get meaningful first wins.
File shares / managed file storage
This is where data accumulates over time:
- Departmental shares
- Project folders
- Long-lived archives
- Shared drives used as “systems of record” (even when they shouldn’t be)
Why this matters: file shares often contain the largest volume of legacy data.
Microsoft 365 (collaboration + email)
M365 now tends to become the center of gravity for modern data sprawl.
Common target buckets include:
- SharePoint (collaboration)
- OneDrive
- Exchange (email & attachments)
Why this matters: collaboration platforms amplify risk because data gets copied, shared, and reshared quickly.
Cloud / SaaS storage (examples: Gmail, Google Drive)
Cloud storage repositories often contain:
- The same sensitive files as file shares
- Plus externally shared links, guest access, and broader collaboration footprints
Why this matters: It’s another very common place for accidental exposure.
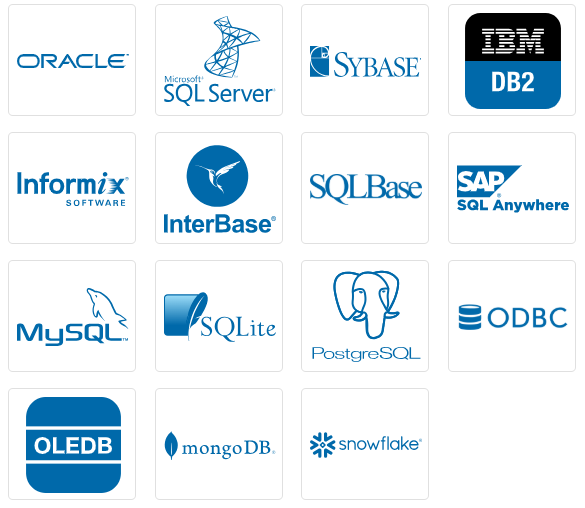
Databases (broad coverage via Native Connectors as well as ODBC)
Databases are where the “official” records often live which can include:
- PII/PHI/PCI in structured fields
- Sensitive business data in tables and views
- Secrets/keys in application tables (yes, it happens)
Spirion can scan a wide range of database platforms using many native DB connecters as well as standard ODBC and OLEDB, which are intentionally broad in use (and that’s why there isn’t a single tidy “complete list” of databases we can scan).
“Many more” targets via ODBC scans using CData connectors
Beyond the common categories above, organizations often ask:
“What about the tools we live in every day?”
This is where CData connectors come in—enabling connectivity to many additional systems and SaaS platforms.
Examples:
- Confluence
- Salesforce
- (and many other business systems supported by connector ecosystem - see Real-Time ODBC Drivers to 300+ Data Sources | CData )
Why this matters: Spirion isn’t limited to “files on disk.” It can reach into the places modern work actually happens.
Authentication
To scan a Target, Spirion needs an approved way to authenticate to it—typically one of these patterns:
- User ID and Password (common for workstations and servers)
- Service account / managed credentials (common for shares and many systems)
- OAuth / app registration (common for M365 and modern SaaS)
- API tokens/keys (common for SaaS platforms)
- ODBC credentials (common for databases)
And one key truth that saves users time:
- Most scanning failures are permissions or network path issues.
Section 5 — Data Types (Detection Intent) and Their Role in Playbook Decisioning
What this section is
This section explains Data Types in Spirion and why they become the center decision point for automation: Playbooks (and remediation actions) almost always start with what you’re trying to detect.
What a Data Type is (definition + why it exists)
A Data Type is Spirion’s definition of a recognizable kind of sensitive information the platform can detect and label (examples: an identifier, a regulated data element, or a secret).
Data Types exist to answer one operationally useful question consistently:
- “What do we want to find, exactly?”
Once Spirion can answer that reliably, playbooks can answer the next question:
- “What should we do when we find it?”
What problem Data Types solve (how they fit end-to-end)
Data Types are how we specify precisely what the platform should detect—and, by extension, what downstream decisions (triage, reporting, remediation) can be made consistently.
Data Types make discovery:
- Intentional (you define what matters)
- Repeatable (the same definition applies scan after scan)
- Measurable (you can report on categories over time)
- Actionable (you can drive consistent remediation and workflow decisions)
In other words: Data Types are the bridge between searching and governing.
How Data Types work (conceptually)
A Data Type typically has:
- A definition (pattern/rules/logic describing what it looks like)
- Optional validation/context logic to reduce false positives
- A display label (what humans see in results and reports)
- An implied risk meaning (how your org interprets it: “high risk” vs “watchlist”)
What “normal” looks like
- You can explain why a Data Type exists (“what risk does it represent?”).
- The same category of information is categorized the same way across scans.
- Findings are filterable/groupable by Data Type in a way that keeps reporting and playbook logic stable over time.
Spirion “AnyFinds” (built-in Data Types available by default)
Spirion includes a set of built-in Data Types called AnyFinds.
These are pre-defined detectors that have been built and improved over years to increase accuracy and reduce noise, providing a strong baseline of common sensitive data types.
AnyFinds available by default:
- Australia: TFN (Tax File Number)
- Bank Account Number
- Canada: SIN (Social Insurance Number)
- Credit Card Number
- Date of Birth
- Drivers License
- E-Mail Address
- Health Information
- Passport Number
- Password
- Personal Address
- Social Security Number
- Telephone Number
- United Kingdom: NHS (National Health Service Number)
- United Kingdom: NINO (National Insurance Number)
Why AnyFinds matter
- They represent the most common sensitive data searches across organizations.
- They’ve been refined over years for high accuracy and low noise.
- They provide stable categories for reporting, trend analysis, and playbook logic.
- They form a durable baseline—custom Data Types can be layered on without losing comparability over time.
Custom Data Types (how you extend beyond AnyFinds)
Every environment has “sensitive” data that won’t be captured fully by out-of-the-box detectors: internal IDs, customer numbers, proprietary project codes, secrets, business-specific terms, or industry-specific formats.
Spirion supports custom Data Types, including:
Regex (pattern-based)
Use when the data has a recognizable structure:
- Internal identifiers with consistent formatting (Student IDs, Employee IDs, etc.)
- Account numbers with known prefixes
- Structured tokens that match a repeatable pattern
Keywords (phrase-based)
Use when the “signal” is a word or phrase:
- “Confidential”, “do not distribute”, “attorney-client”
- Internal project names (when appropriate)
- Regulated terms that aren’t reliably represented by a pattern alone
Dictionaries (a file/list of terms)
Use when you have a large controlled vocabulary:
- Product codenames
- Sensitive client names (if your process allows)
- Lists of internal terms that indicate higher risk when present
SearchAPI (advanced/custom logic)
Use when basic patterns aren’t enough and you need richer matching behavior, such as:
- Multi-step validation (“match pattern AND confirm checksum/context”)
- Conditional logic based on surrounding text
- More complex detection instructions than regex/keywords/dictionaries can express cleanly
(SearchAPI is the “power tool” for sophisticated, highly specific detection logic and validation. SDDs can then combine SearchAPI-driven matches with other Data Types and conditions as part of a broader business rule.)
Sensitive Data Definitions (SDDs) (context-aware detection rules built from Data Types)
Sensitive Data Definitions (SDDs) are logical combinations of existing Data Types (especially AnyFinds and custom Data Types) that you can treat as a single Data Type in scans and playbooks.
Why Sensitive Data Definitions exist
Many real-world “sensitive data situations” are sensitive because of context, not because of one pattern alone. SDDs let you express that context directly, without forcing everything into one regex.
How Sensitive Data Definitions work (conceptually)
- You combine multiple AnyFinds and/or custom Data Types into one definition.
- You can apply logical and proximity operators between them (examples include Near/Far (with distance), Require/Allow, and comparisons such as Equals / Not Equals / Greater/Less Than, etc.).
- You then reference the SDD as if it were a single Data Type in:
- Playbook conditions (e.g., “Data Type contains: [My SDD]”)
- Scan configuration logic and actions
What this enables (examples)
- “Flag only files that contain both a Credit Card Number and a Social Security Number near each other.”
- “Treat as higher risk only when a proprietary Dictionary term appears near an Email Address AnyFind.”
How Sensitive Data Definitions relate to other custom Data Types
- Regex/Keywords/Dictionaries/SearchAPI are primarily “detectors” (ways to recognize something).
- Sensitive Data Definitions are “decision logic over detectors” (ways to declare when combinations/relationships matter).
- Sensitive Data Definitions don’t replace detectors; they orchestrate them into a higher-level rule.
Why Data Types are the center decision point in Playbooks
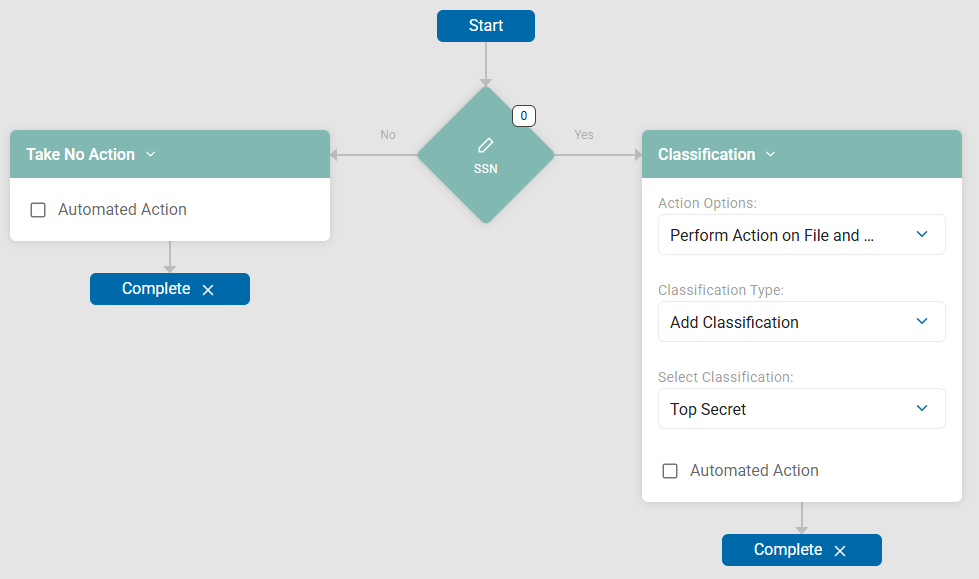
Playbooks exist to make behavior repeatable:
- “When we find X, we do Y, if not do Z.”
The most common first decision in a playbook is exactly that:
- IF Data Type = X → THEN do Y → ELSE do Z
Because Data Types are:
- Consistent labels for what you intended to find
- Easy for humans to interpret (privacy, security, IT, data owners)
- The cleanest way to encode “risk-based behavior” without building fragile, over-complicated logic
Where Sensitive Data Definitions fit in playbook decisioning
When “X” isn’t a single detector but a contextual situation, SDDs let you keep the playbook logic clean:
- IF Data Type = [My Sensitive Data Definition] …
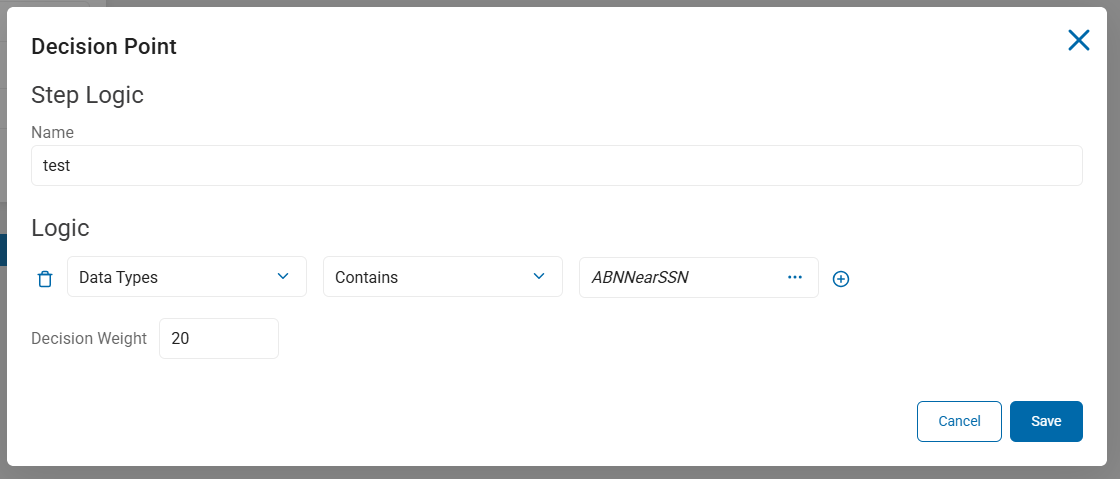
Examples (conceptual, not prescriptive)
- IF Credit Card Number → then trigger redaction
- IF Password / secrets → then classify and trigger notification
- IF E-Mail Address → then classify document
- IF [Sensitive Data Definition: Credit Card NEAR SSN] → then quarantine the file to our preset secure quarantine location
Section 6 — Playbooks 101 (From Detection Intent → Action → Proof)
What this section is
This section explains Playbooks in Spirion: what they are, why they exist, how they work at a high level, and how they connect directly to Data Types and Sensitive Data Definitions (SDDs).
Core idea: Data Types/Sensitive Data Definitions define what we want to find; Playbooks define what we do when we find it.
What a Playbook is (definition + why it exists)
A Playbook is Spirion’s automation and decisioning layer: a set of rules that evaluates findings (Data Types/SDDs + context) and triggers actions.
Playbooks exist because discovery alone doesn’t reduce risk. Organizations need repeatable, auditable behavior such as:
- Notify the right owner/team
- Reduce exposure (restrict access / remove risky sharing)
- Relocate, secure, or remove data (when appropriate)
- Generate consistent outcomes you can report on
What problem Playbooks solve (how it fits end-to-end)
Without playbooks, teams typically fall into one of two traps:
- Manual fatigue: findings pile up, and response becomes inconsistent.
- Over-automation too early: actions are applied without enough context, creating operational risk.
Playbooks solve this by encoding “policy into behavior”:
- Consistent decisions
- Consistent actions
- Consistent audit trail
They also allow the platform to operate at scale: the same rules apply across millions of files, mail items, cloud objects, and database records.
How Playbooks work (conceptual model)
At a high level, playbooks follow the same pattern:
- Trigger
- “A scan produces a finding” (or “a finding meets criteria”)
- Evaluate conditions
- Most commonly: Data Type or Sensitive Data Definition
- Often also: target category, location/path, owner/department, etc.
- Execute actions
- One action or a sequence of actions (with success/failure state)
- Record outcomes
- What triggered, what ran, what succeeded/failed, and what changed
You can think of a playbook as:
IF (finding matches intent + context) → THEN (take action) → AND (record it).
Data Types and SDDs are the primary “decision input”
In practice, playbooks almost always begin with a condition like:
- IF Data Type = [AnyFind: Credit Card Number]
- IF Data Type = [Custom Regex: Internal Customer ID]
- IF Data Type = [SDD: Credit Card NEAR SSN]
This keeps playbooks readable and stable:
- detection logic lives in Data Types/SDDs
- response logic lives in Playbooks
Two execution modes: automatic vs manual (human-in-the-loop)
Spirion supports two operationally important modes of remediation:
1) Automatic actions (“as it’s found”)
In this mode, actions run without waiting for a human to click anything—based on playbook logic.
Use cases:
- Consistent, low-risk actions (e.g., notify, classify/label where supported, reduce exposure patterns where supported)
- Urgent categories where time matters (depending on your governance model)
- High-volume environments where manual review is not feasible
2) Manual actions (review in console → click-to-remediate)
In this mode, findings surface in the console and an operator initiates actions through the “playbook executor”.
Use cases:
- High-impact actions that should be reviewed
- Edge cases where context matters
Important mental model:
Manual and automatic are not mutually exclusive. Many programs use both:
- Automatic “safe” actions for broad coverage
- Manual review gates for strong/destructive actions
Action types (what playbooks can do at a high level)
Actions are target-dependent (what’s possible varies by endpoint vs M365 vs file share vs SaaS vs database). But the action families are consistent:
Safe / reversible actions (common foundations)
- Notify (owners, security, privacy, records teams)
- Tag/label/classify (where supported by the target)
- Reduce exposure patterns (where supported, e.g., restrict risky sharing states)
- Create an operational task (execute powershell or bat file scripts for internal workflow)
Strong / potentially destructive actions (use with governance)
- Quarantine / Move
- Redact
- Delete
Operational reality: strong actions require:
- Correct permissions
- A clear process (who approved, what exceptions exist)
- A rollback story (or compensating controls) where applicable
Guardrails: how experts keep playbooks safe
A strong playbook program usually includes these guardrails:
- Scope guardrails: limit actions to known paths, repositories, or business units initially
- Context guardrails: require combinations (Sensitive Data Definitions) or confidence thresholds before strong actions
- Progressive enforcement: start with notify/tag/restrict; escalate to quarantine/move/delete when confidence and process maturity are high
- Audit expectations: ensure playbook actions produce records that can be reviewed later
This is how you avoid the classic failure mode: “we automated remediation and immediately created operational fallout.”
What “normal” looks like (system behavior, not UI clicks)
When playbooks are functioning normally you will observe:
- Scans produce findings
- Findings that match playbook criteria produce remediation actions
- Remediation action results are visible as a status/outcome (success/failure) tied to the finding or job history
- Reporting reflects both “match” and “remediation” states over time
Common gotchas (playbook thinking traps)
- Assuming all actions exist everywhere: action availability depends on the target category and permissions.
- Automating strong actions without governance: “delete” and “quarantine” can be correct actions—but only with guardrails and auditability.
Section 7 — Remediation (Automatic and Manual Paths)
What this section is
This section describes the remediation capabilities available in Spirion once sensitive data has been detected, and how those actions are applied in two operational paths:
- Automatic remediation (Playbooks / Workflows execute actions as findings occur)
- Manual remediation (operators review findings in the console and explicitly execute actions)
Core idea: Detection identifies what exists; remediation defines what changes (or what gets tracked) as a result.
What “Remediation” means in Spirion
In Spirion, remediation is any action taken in response to a finding, including:
- Direct modifications to the data or object (move, delete, redact)
- Classification/protection steps (apply labels)
- Operational workflow steps (assign, track status)
- Custom actions (execute scripts to integrate with external tools/processes)
- Deliberate non-action (monitoring, phased rollout, or suppression)
Remediation actions are typically invoked via:
- Playbooks (automation/decisioning layer)
- Workflows (assignment/notifications + status tracking, with follow-on remediation steps)
- Console manual actions (review → click-to-remediate)
Two remediation execution modes
1) Automatic remediation (Playbooks / Workflows)
In automatic mode, remediation actions execute based on rule evaluation without waiting for a human to click anything. Operationally, this is how remediation scales.
Conceptual flow
- Scan produces findings (Data Type / SDD matches)
- Playbook/Workflow conditions evaluate context
- Matching actions execute
- Outcomes are recorded for reporting/audit
Where it fits best
- Consistent, repeatable actions at volume
- Stable “policy-to-behavior” enforcement
- Scenarios where time-to-response matters
2) Manual remediation (Console-driven)
In manual mode, findings are visible in the console, and an operator explicitly initiates remediation.
Conceptual flow
- Scan produces findings
- Findings appear in the console for review
- Operator validates context (location, Data Type/SDD, scope, exposure)
- Operator selects an action in the 'playbook executor' (click-to-remediate)
- Outcome is recorded, and the finding/state reflects the change
Where it fits best
- Actions requiring human judgment or approval
- High-impact actions (quarantine/shred/redact) when governance requires a gate
- Exception handling and edge-case validation
Important operational reality
Most mature implementations use both:
- Automatic actions for broad, repeatable controls
- Manual actions for high-impact remediation and exception cases
Remediation actions available (typical catalog)
1) Core remediation actions (Playbooks / Workflows / Manual where available)
Quarantine
- What it does: Moves matching files/results to a secure, preset location.
- Where configured: Quarantine location is defined by an admin in Global Settings, then used in Playbooks/Workflows (and surfaced for manual use where applicable).
- Why it’s used: Reduce exposure while preserving the data (retention, legal, forensics).
Shred
- What it does: Permanently deletes matching files/results.
- UI language: Often presented as “Shred – permanently delete the results matching the playbook rule.”
- Why it’s used: Data minimization, cleanup of clearly unnecessary data, privacy-driven removal requirements.
- Governance note: Treat as high-impact and irreversible unless separate backup/restore controls apply.
Redact
- What it does: Scrubs/removes the sensitive data from the result/content.
- Endpoint behavior note: In endpoint contexts, redaction behavior can be tied to endpoint lifecycle (e.g., scrub on close in the endpoint application model).
- Why it’s used: Keep the file/object but remove sensitive elements.
Execute Script (custom remediation)
- What it does: Runs a script whenever there are results matching the rule.
- How it’s configured: Selected as Execute Script in the remediation dropdown; script is uploaded or referenced in the remediation step.
- Why it’s used: The “escape hatch” for custom remediation and integrations:
- Bespoke move/copy workflows
- Invoking encryption tools
- Calling external APIs or internal services
- Operational note: Script lifecycle discipline matters (versioning, testing, rollback, least privilege).
Take No Action
- What it does: Leaves results as-is for that rule.
- Why it’s used: Detection-only monitoring, baselining, or deliberate non-enforcement states.
Ignore
- What it does: Ignores all future instances of a given result across all playbooks.
- Why it’s used: Suppress known benign patterns you don’t want repeatedly processed.
- Operational note: Treat “Ignore” as a governance decision; revisit periodically to ensure it hasn’t become a blind spot.
2) Classification & notification–adjacent actions
These don’t necessarily “remove” data the way quarantine/shred/redact do, but they are core to operational remediation programs because they mark, govern, and influence downstream controls.
Classify (Spirion classification actions)
Spirion supports classification in multiple forms, depending on the target and file system:
A) M365 file classification (in-content)
- What it does: Writes classification into the content of supported Microsoft 365 file types (where applicable).
- Why it’s used: Ensures the classification is embedded with the document in a way that travels with the file content and can be recognized by tooling that inspects document content/metadata.
B) NTFS classification (Alternate Data Stream / ADS)
- What it does: Writes classification into the file’s NTFS Alternate Data Stream (ADS).
- Why it’s used: Enables classification tagging at the file system level without altering the primary file content stream—useful for workflows where you want classification to be present but avoid modifying the document body itself.
C) MIP Label (Microsoft Information Protection)
- What it does: Applies a Microsoft Information Protection label to matching results.
- How it’s configured: Select a specific Microsoft label and set “Label Application” options.
- Why it’s used: Leverages Microsoft’s labeling/protection ecosystem for downstream enforcement (classification, protection, and policy-driven controls as configured in Microsoft tooling).
Operational note: “Classification” is not a single mechanism. Spirion can classify by writing into the document content (for applicable M365 file types), by writing to NTFS ADS for NTFS-resident files, and/or by applying MIP labels in the Microsoft ecosystem.
Notify
- What it does: Sends an email notification to:
- Specific email address(es), and/or
- Selected groups/roles/users (depending on environment modeling)
- Why it’s used: Establishes ownership and accountability without requiring all remediation to be centrally executed inside Spirion.
3) Workflow-based remediation and tracking (Workflows)
Workflows are the operational layer for treating remediation as a managed process.
What workflows add
- Assign results to users
- Notify them (email and/or other configured mechanisms)
- Track status from identification through remediation completion
Actions supported in workflows
Workflows can execute many of the same remediation actions, including:
- Encrypt
- Redact
- Quarantine
- Shred
- Run scripts (same concept as Execute Script, invoked by workflow rules)
How “Encrypt” typically shows up
- Encryption is often achieved via:
- Microsoft labeling/protection (e.g., MIP label-driven controls), and/or
- custom scripts that invoke the organization’s encryption toolchain
Why workflows matter
Even without pushing incidents into an external ticketing system, workflows provide:
- Accountable assignment
- Trackable progress/closure
- Measurable remediation throughput
- An auditable narrative (“identified → assigned → actioned → verified”)
A practical “action ladder” (safe-to-strong)
Operationally, remediation programs typically implement an “action ladder” that reflects risk and governance requirements:
Lower-risk / governance-first
- Take No Action (monitor)
- Notify
- Assign
- Label (MIP)
Medium-impact
- Quarantine (containment while preserving data)
- Redact (remove sensitive elements while retaining the file/object)
Highest-impact
- Shred (permanent deletion)
- Execute Script (impact depends entirely on what the script does)
What “normal” looks like
You know remediation is operating normally when:
- Findings reliably trigger intended playbook/workflow rules (automatic path)
- Operators can consistently review and execute actions with clear outcomes (manual path)
- Action outcomes are visible as success/failure states tied to the finding or job history
- Reporting shows measurable movement over time (identified → reduced exposure → resolved)
Common gotchas (what experienced operators watch for)
- Permissions mismatch: policy logic is correct, but the agent identity can’t perform the action on the target.
- Target-specific differences: not every action is meaningful/available across all target types in the same way.
- Overuse of Ignore: suppresses noise, but can become a blind spot if conditions change.
- Script sprawl: Execute Script is powerful; it also creates operational dependency on script lifecycle management.
- Shred without governance: deletion can be correct, but it must align with retention, legal, and backup/restore posture.
Section 8 — Scans & Scheduling (Defining Work, Controlling Blast Radius, and Re-Scanning Intelligently)
What this section is
This section explains how Spirion turns detection intent (Data Types / SDDs) into repeatable operational execution: scans (what runs) and schedules (how it repeats). It also covers two concepts that matter immediately at scale:
- Blast radius control (how to avoid “scan the entire world” mistakes)
- Search History (how rescans avoid reprocessing previously scanned locations)
What a Scan is (definition + why it exists)
A scan is a defined unit of work that tells Spirion:
- Where to look (targets + scope)
- How to authenticate and connect (target details)
- What to find (Data Types / SDDs)
- How to execute (local vs non-local behavior, agent distribution)
- What to do when matches occur (playbooks / remediation)
Scans exist because discovery programs must be repeatable and auditable. “We scanned once” is not an operational posture—recurrence and consistency matter.
Scan definitions vs scan runs (important distinction)
Operationally, treat these as two different things:
- Scan definition: the reusable configuration (scope + detection intent + execution parameters)
- Scan run (job instance): a single execution of that definition at a point in time
This distinction matters because:
- Definitions evolve (scope changes, Data Types expand, scheduling is tuned)
- Run history is what you use to understand progress, duration, and operational impact
Execution model: local vs non-local scans (how work distributes)
This ties directly back to the agent execution model:
Local scans
A local scan runs on the local machine where each assigned agent is installed.
- If multiple agents are assigned to a local scan:
- Each agent runs the same local scan on its own endpoint
- Each endpoint performs its own discovery + search (locally)
- Results roll up as independent endpoint scan results
Implication: assigning multiple agents does not split one machine’s local scan workload; it expands coverage across multiple endpoints.
Non-local scans (everything else)
A non-local scan targets a remote/system repository (M365, file shares, SaaS, databases, etc.). Non-local scans can be executed in two valid patterns:
A) Single-agent non-local scan
- One agent does both roles:
- Discovery (enumeration/work creation)
- Search (execution of work items)
- Practically, these roles run concurrently as separate threads within the same agent process.
B) Distributed non-local scan
- One discovery agent coordinates enumeration and work creation for the scan scope.
- One or more search agents execute work items (fan-out).
Implication: adding search agents can increase throughput for distributed non-local scans, but the target system (M365 throttling/backoff, share performance, database limits, network latency) can become the bottleneck before agents do.
Blast radius control (the difference between “a scan” and “an incident”)
The most common operational failure mode is not technical—it’s scope design.
Classic example:
“Exchange Online has 4,800 mailboxes. Let’s scan all mailboxes, for all Data Types, across all message/file types.”
That is a recipe for:
- Long runtimes
- Throttling/backoff behavior
- Noisy results and operational overload
- A misleading sense that “the product is slow” (when the scope is simply enormous)
Blast radius control is the discipline of making scans bounded, explainable, and reversible.
What blast radius control looks like in practice
A well-formed scan definition is intentionally constrained along these axes:
- Target slice
- A subset of mailboxes/sites/shares/endpoints
- A business unit, region, pilot group, or high-risk segment
- Location boundaries
- Path scoping on shares
- Site/library scoping in M365
- Mailbox selection rules in Exchange Online
- Content boundaries
- File type constraints where appropriate
- Message type constraints where appropriate
- Detection boundaries
- Choose a bounded set of Data Types/SDDs aligned to the objective
- Avoid “turn on everything” without a clear downstream plan
- Time boundaries
- Schedule in maintenance windows where needed
- Stage large targets into waves rather than one massive run
Why experts care about blast radius
Blast radius control is how you ensure:
- Performance remains predictable
- Results remain actionable (not just voluminous)
- Remediation doesn’t become chaotic
- Scheduling is sustainable
Scheduling (how scanning becomes a program)
Scheduling is not just “run it nightly.” It’s how you convert discovery into an operational posture.
At a high level, schedules typically represent one (or more) of these patterns:
- Baseline coverage
- Establish a known posture across a scope (initial inventory)
- Recurring enforcement
- Keep posture current as data changes (new documents, new mail, new shares)
- Target-specific cadence
- Endpoints, M365, shares, and databases have different change rates and operational constraints
Key point: schedule design should align with:
- How fast the target changes
- How expensive the scan is (time/load)
- How quickly remediation needs to happen
- The organization’s tolerance for operational impact
Search History (why rescans get smarter over time)
A powerful operational feature in Spirion is Search History.
What it does (conceptual)
Spirion records scan history so that during rescans it can recognize previously scanned locations and avoid reprocessing unchanged content (using a hash of the file to ensure that content remains unchanged). In other words: rescans can become incremental rather than “start from scratch every time.”
Why it matters
In large target scenarios—like Exchange Online—even when you do a good job slicing scope, you still need rescans to be sustainable.
Search History helps because:
- Once mailboxes/locations have been scanned, subsequent runs can skip content that is recognized as already searched with the same playbook
- This reduces repeat work, improves runtime predictability, and keeps schedules feasible at scale
Practical mental model
During rescans, Spirion can skip content when “the hash of the location (email in this case) is recognized.”
Operational implication
Search History is one of the key mechanisms that makes:
- “scan a large environment” and
- “keep scanning it”
two different operational problems—Spirion is designed to handle the second without endlessly repeating the first.
Common gotchas (what drives most pain)
- Unbounded scope: scanning an entire enterprise target (thousands of mailboxes/sites) with every Data Type and broad content selection.
- No slicing strategy: not segmenting targets into manageable, explainable units.
- Assuming agents are the bottleneck: target throttling and access constraints often dominate.
- Treating schedules as static: cadence needs tuning as scope grows and as Search History changes rescan behavior.
Section 9 — Search Results (How to Interpret What Spirion Produces)
What this section is
This section describes how to interpret Search Results in Spirion as an operational artifact: what they must tell you, how to reason about them over time, and how to connect them to remediation outcomes.
What a “good” Search Result must be able to answer
A Search Result is operationally useful when it can answer these questions cleanly:
- What object is this?
- the object identity and its location/context (file/message/item/record) within the scanned target
- Why is it flagged?
- which Data Type(s) and/or SDD(s) matched
- evidence context as configured (including any pre-shipping redaction behavior)
- How certain is it?
- validation/confidence indicators where applicable, plus contextual cues (isolated vs repeated patterns)
- What happened because of it?
- whether playbooks/workflows/manual actions were triggered
- what actions were attempted and their outcomes
- What is its current state?
- open/assigned/in-progress/resolved (if tracked)
- classified/labeled state (content / NTFS ADS / MIP as applicable)
- quarantined/shredded/redacted outcomes if applied
Search Results over time: baseline, drift, and Search History effects
Search Results are most useful when understood as a time series, not a one-off snapshot:
- Baseline scans establish what exists across a defined scope.
- Recurring scans measure drift: new objects, modified objects, and changes in exposure patterns.
Search History changes what “rescan” means.
Because Spirion can recognize previously scanned locations and skip unchanged content (via hashing), recurring scans can behave more like incremental enforcement than “start from scratch every time.”
Operational interpretation:
- If a rescan produces fewer results, it may indicate less change, not less coverage.
- Net-new results often represent new or modified content within the effective scope, not a re-listing of everything already known.
Search Results and remediation: “found” vs “actioned”
A crucial distinction when interpreting outcomes:
- Found: the platform detected a match and produced a Search Result.
- Remediation action attempted: a playbook/workflow/manual action was triggered.
- Remediation action succeeded: the action completed successfully and materially changed the object/state.
These are intentionally separate because:
- Detection volume does not equal risk reduction
- Action attempted does not equal completed remediation
- Success depends on permissions, target capabilities, and governance constraints
Why Search Results are the connective tissue of the platform
Search Results are where the entire platform converges:
- Scan scope determines where they come from
- Data Types/SDDs explain why they exist
- The playbook workflows determine what should happen next
- Remediation/classification actions determine what changed
- Reporting aggregates them into trends and program metrics
Section 10 — Reporting & Metrics (Proving Coverage, Risk, and Reduction)
What this section is
This section describes what Spirion reporting should prove in a durable program. It focuses on metrics that stay meaningful as scope grows, targets diversify, and remediation becomes automated.
Core idea: reporting is only credible when it connects three things:
- Coverage (what was actually scanned)
- Risk (what was found)
- Reduction (what changed because of actions)
Coverage metrics (what did we actually scan?)
Coverage metrics answer: “How complete is our visibility?”
Common coverage dimensions:
- Target coverage
- Which repositories were in scope (endpoints, shares, M365 sites/mailboxes, SaaS, databases)
- How coverage is sliced (business unit, region, ownership, tier)
- Execution coverage
- Scan runs completed vs failed vs partial
- Time window coverage (when was each slice last scanned)
- Scope coverage
- What was included/excluded (paths, site collections, mailbox sets, file/message types)
- “Blast radius” boundaries (how broad each scan definition is)
Operational truth: risk reporting without coverage context is misleading.
Risk metrics (what did we find?)
Risk metrics summarize Search Results by categories that map to how people make decisions.
Common ways to break down risk:
- By Data Type / SDD
- AnyFinds (baseline comparability)
- Custom Data Types
- SDDs (contextual, higher-signal situations)
- By repository or target type
- Where risk concentrates (e.g., file shares vs M365 vs endpoints)
- By ownership / organizational lens
- Business unit, department, location, application owner (where those mappings exist)
- By exposure patterns
- Especially meaningful for cloud collaboration targets (where sharing state is part of the risk story)
Important interpretation rule: volume is not severity by itself. The highest-value metrics correlate results to what you care about (data types and context) and where it matters most (high-risk repositories or business units).
Reduction metrics (what changed because we acted?)
Reduction metrics answer: “Are we actually lowering risk?” They tie directly to playbooks, workflows, and manual remediation.
The key states to track:
- Found (Search Results produced)
- Action attempted (playbooks/workflows/manual initiated)
- Action succeeded (state actually changed)
- Residual/open (still present, still exposed, or still awaiting remediation)
Common reduction views:
- Remediation outcomes by action type
- Quarantine vs redact vs shred vs classify vs notify vs ignore vs scripts
- Time-to-remediate
- Detection → action attempted
- Action attempted → action succeeded
- Detection → closure (end-to-end)
- Backlog and closure rate
- Open results over time (are you accumulating debt or burning it down?)
Operational truth: “action attempted” without “action succeeded” is where most programs discover permission gaps and governance constraints.
Classification metrics (proof of “marked and governed” state)
Because Spirion classification is more than MIP labels, classification metrics can become a major pillar of “reduction” reporting.
Useful classification cuts:
- Classified by method
- In-content classification (applicable M365 file types)
- NTFS ADS classification (NTFS-resident files)
- MIP label application (Microsoft ecosystem)
- Classified by Data Type / SDD
- Which detection intents drive classification policies
- Classified vs unclassified within scope
- Where governed state is established vs still missing
This supports “governance posture” reporting: not only “we found it,” but “we marked it and control follows.”
Reporting over time (baseline, drift, and Search History awareness)
Reporting should reflect that scanning is repeated:
- Baseline posture
- What existed at time-zero across defined scope
- Drift
- New/changed results since prior runs
- Rescan interpretation
- Search History can prevent reprocessing unchanged content; reporting should interpret deltas as net-new or net-changed within effective scope, not “everything re-found.”
This prevents the classic confusion where stakeholders expect identical counts every run.
Common reporting traps (what to avoid)
- Reporting results without coverage
- “We found 10,000 items” is meaningless without “out of what scope?”
- Over-indexing on totals
- Totals obscure where the real risk concentrates (data type + repository + exposure)
- Treating notify as reduction
- Notify is an action; reduction is when risk state changes (restricted, classified, quarantined, redacted, shredded)
- Ignoring “failed actions”
- Failure modes are signal: permissions, target capability differences, network constraints, or governance gates
Section 11 — Security & Data Handling (Trust Boundaries, Credential Handling, Redaction, and Encryption)
What this section is
This section explains the security model of Spirion SDP (SaaS) from a data-handling perspective:
- Where scanning and analysis occur
- What data leaves the customer environment (and what does not)
- How authentication material (credentials and tokens) is handled for Targets
- How results are protected in transit and at rest
- How agent-side redaction can reduce exposure of match evidence before anything is shipped
This section is designed to be reusable for security reviews and for operators who need a clear trust boundary mental model.
Trust boundary: where scanning actually happens
Spirion SaaS uses a deliberate trust boundary:
- Scanning and analysis occur inside the customer environment, on customer-controlled machines where agents run.
- The customer controls:
- Host security posture (hardening, patching, EDR, local access)
- Network egress paths (firewalls, proxies, VPN constraints)
- Credentials and permissions used to access targets
- What is scanned (scope) and what actions are allowed (policy/playbooks/workflows)
Operational implication: Spirion does not pull entire repositories into SaaS for scanning. The compute that inspects data is deployed under the customer’s security controls; SaaS provides orchestration, ingestion, and reporting.
Authentication and credential handling (Targets)
Most Targets require Spirion to authenticate in order to enumerate and scan content. SDP supports multiple authentication patterns, and the security posture depends on the target type.
Pattern A: Customer-provided credentials (common for many target types)
For many Targets, the operator configures the credentials necessary to access that system (for example, service accounts used for shares, systems, or other repositories).
Trust boundary
Even though the console is SaaS, credential handling is an explicit part of the platform’s security model because Targets often require stored authentication material to run scans consistently.
Pattern B: OAuth consent + token-based access (common for cloud ecosystems)
For certain cloud targets (for example OneDrive / Microsoft 365, and similarly Google Drive-style ecosystems), access is typically granted through a vendor OAuth flow:
- The customer authorizes access by granting consent to a (multi-tenant) application.
- The platform operates using tokens issued by the vendor (scoped access), rather than receiving the user’s raw username/password.
Why this matters
- The customer does not provide the platform with their actual interactive credentials or “password equivalents.”
- Access is governed by the vendor’s token model:
- Scopes/permissions granted
- Consent controls
- Revocation ability
- Conditional access and policy enforcement (vendor-dependent)
Operational note
Token-based access is still powerful and must be governed, but it is materially different from storing and protecting a reusable password. It also makes access revocation and permission scoping more explicit and auditable.
What data leaves the customer environment (and what does not)
Data that remains customer-side
The following stays within the customer environment:
- The original source content being scanned (files, mailbox items, database content, etc.)
- Target repositories themselves (shares, mail systems, SaaS content stores, DB systems of record)
- Local runtime artifacts not explicitly configured for result reporting/shipping
Data that is shipped to Spirion SaaS
What is shipped across the boundary is the results payload, which typically includes:
- Search Result metadata (what matched, where, when, and why)
- Scan/job execution state needed for progress tracking
- Optional match evidence/snippets (based on configuration and target capability)
Operational note: the results payload exists so the console can support reporting, playbooks/workflows, and audit history without centralizing the raw source repositories.
Encryption and protection (in transit and at rest)
Spirion’s results-handling model is designed around baseline protections across the full path—from creation, to queueing, to shipment, to storage:
- Protected at rest (client-side queue): Search Results staged for shipment (the shipper queue) are protected at rest while residing in the local PostgreSQL “queue” store.
- Encrypted in transit: Search Results are shipped from the agent to Spirion SaaS over encrypted transport.
- Protected at rest (SaaS-side persistence): Search Results stored within the Spirion SaaS persistence layer are protected in storage.
This aligns with the trust boundary model: even the limited results payload is protected end-to-end, including while buffered locally awaiting shipment.
Redaction before shipping (agent-side masking)
Spirion can optionally be configured so that match evidence is partially redacted by the agent before it is shipped to SaaS.
What this means
- The agent detects a sensitive value
- The agent masks configured portions of that value before creating the shipped payload
- The console displays only the permitted portion plus masking characters (e.g.,
***, or another configured character)
Why this matters
- It reduces exposure risk even within result evidence
- It enables operational workflows (“prove we found it”) without centrally storing full sensitive values in the SaaS reporting plane
- It supports governance models where visibility of full match content is restricted by policy