
How to Read a Log File
This article explains the following:
- Where the logs live
- How a log line is structured
- How to read the most common entries
- How to raise the logging detail when the default output is not enough
The Two Log Types
Every managed endpoint produces two distinct families of logs. Knowing which one to open saves a great deal of time, because they answer completely different questions.
- EPS logs (Endpoint Service / communication logs) — Written by the endpoint service, the background service that talks to the Console. Open these when the endpoint is missing from the Console, has not polled recently, will not accept a policy, or will not accept a scheduled search.
- Search logs (System Search logs) — Written by the search engine. Open these when a search ran but the results look wrong: locations skipped, permission failures, or fewer matches than expected.
Rule of thumb: If the problem is “the Console and the Agent are not talking,” read the EPS log. If the problem is “the search ran but the outcome is wrong,” read the Search log.
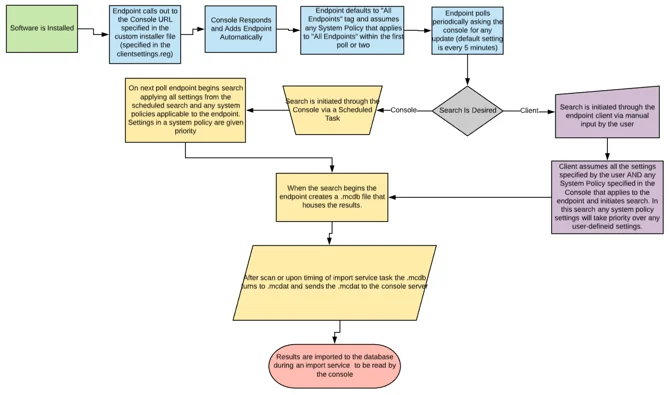
The Console dispatches work to managed endpoints and receives results back. The EPS log records both halves of this conversation.
Where Logs Are Stored
EPS Logs
- Windows:
C:\ProgramData\Identity Finder\Logs\EPS ProgramDatais a hidden folder. Either type the path directly into the Explorer address bar, or enable Show hidden files in Folder Options.
- macOS:
/Users/Shared/.identityfinder/Application/{04964656e-7469-7479-2046-696e6465720}/Logs/EPS - This folder is hidden. To open it in Finder, run the following in Terminal:
open "/Users/Shared/.identityfinder/Application/{04964656e-7469-7479-2046-696e6465720}/Logs/EPS"
- Linux:
- Version 11.4 and later:
/var/lib/.identityfinder/Application/{04964656e-7469-7479-2046-696e6465720}/Logs/EPS - Version 11.3 and earlier:
/var/lib/identityfinder/Logs
- Version 11.4 and later:
Search Logs
- Windows:
C:\ProgramData\Identity Finder\Logs\SystemSearch - macOS:
/Users/Shared/.identityfinder/Application/{04964656e-7469-7479-2046-696e6465720}/Logs/SystemSearch open "/Users/Shared/.identityfinder/Application/{04964656e-7469-7479-2046-696e6465720}/Logs/SystemSearch"
- Linux:
- Version 11.4 and later:
/var/lib/.identityfinder/Application/{04964656e-7469-7479-2046-696e6465720}/Logs/SystemSearch - Version 11.3 and earlier:
/var/lib/identityfinder/Logs
- Version 11.4 and later:
Note: The GUID in the macOS and Linux paths is a fixed application identifier — it is the same on every machine and is not a per-endpoint value. Quote the path in the shell so the braces are not interpreted by bash or zsh.
Anatomy of a Log File
The File Name
Log files are named for the service and the moment the log was opened, for example:
EPS_2019-03-26_16-40-17.logEPS— The component that wrote the file.2019-03-26_16-40-17— The local date and time the file was created, which is normally the moment the service last started.
A new file is created each time the service restarts, so the folder accumulates one file per service lifetime.
Always sort by date modified and open the most recent file first — and note that a folder full of files spanning only minutes apart is itself a symptom, because it means the service is restarting repeatedly.
The Log Line
Each line follows the same four-part structure:
<date> <time>,<milliseconds> <LEVEL> - <message>For example:
2019-03-26 16:40:17,119 INFO - Endpoint service started. Version: 10.7.0.0- Date and time —
2019-03-26 16:40:17,119. Local machine time, with milliseconds after the comma. Use this to line up endpoint activity against Console events; if the endpoint clock is skewed, correlation will be misleading. - Severity level —
INFO. See Severity Levels below. - Separator — A space-hyphen-space (
-) that always divides the header from the message. - Message — The event itself. Errors frequently carry a parenthesised context and a numeric system error code, which is the single most useful token to search on.
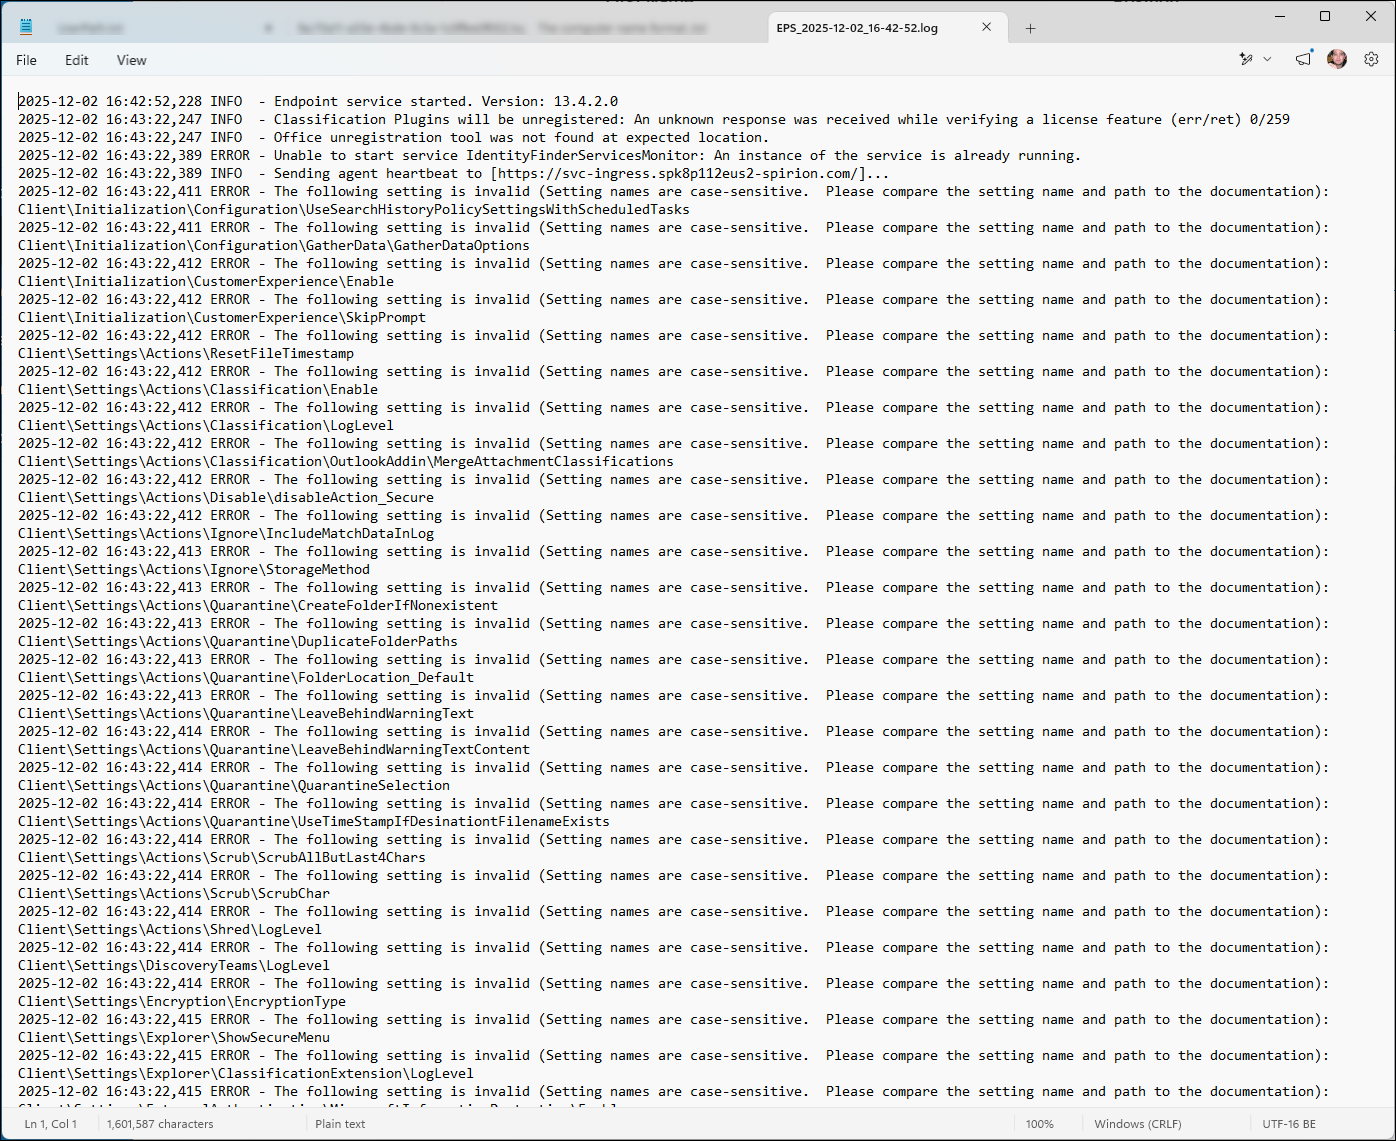
A typical EPS log opened in Notepad. Note the file name in the title bar, the leading INFO line recording the service start and agent version, and the repeating ERROR pairs that follow.
Reading the Log: A Worked Example
Using the log above, here is how to work through it line by line.
1. Confirm the service started and note the version.
2019-03-26 16:40:17,119 INFO - Endpoint service started. Version: 10.7.0.0This is the first line of nearly every EPS log. It confirms the service came up and tells you the agent version, which matters because fixes and required settings are version-specific. If this line is missing or is immediately followed by errors, the problem is at startup rather than in normal operation.
2. Find the first error, not the last.
2019-03-26 16:42:31,665 ERROR - Unable to get command line for Spirion process (Unable to find any process name in list of running processes)
2019-03-26 16:42:31,665 ERROR - The Spirion scheduled task did not initialize in a reasonable amount of time. The task is not running properly.
- These two lines share an identical timestamp, which means they are one event reported twice: a cause and its consequence.
- The service could not find a running Spirion process, so the scheduled task it was waiting on never initialised. The first line is the actionable one; the second is a downstream symptom.
- This is the most important habit when reading Spirion logs: errors cascade. Diagnose the earliest error in a cluster and the rest usually disappear with it.
3. Recognise repetition as a retry loop.
- The same pair recurs at
16:44:41and16:46:51— roughly every two minutes and ten seconds. - Evenly spaced, identical errors are the polling or retry interval, not new failures.
- Count the distinct events, not the lines: three identical repetitions is one unresolved problem, not three problems.
4. Read the exception format.
2019-03-27 08:52:52,531 ERROR - Service Client Exception: Service call failed (Context: GetClientState. An HTTP processing error occurred). System Error: ...Communication errors use a consistent shape worth learning:
- Service Client Exception — the failure occurred while calling the Console.
- Context: the specific call that failed.
GetClientStateis a routine poll;RequestGuidis the initial registration handshake. A failingRequestGuidmeans the endpoint never registered and will not appear in the Console at all. - System Error: the numeric code from the operating system. On Windows these are WinHTTP codes such as 12002, 12007, 12029, 12030 and 12175; on macOS they appear as named errors with a number in parentheses, such as
Connection refused (61).
The numeric code is what you search on. Look it up in Common EPS Log Errors and Their Meaning below.
5. Note the date rollover.
In this example the errors on 2019-03-26 are followed by an entry on 2019-03-27 in the same file. The service ran continuously across midnight; the file did not roll. Always check the date as well as the time before concluding that two entries are related.
Severity Levels and What They Mean
- INFO — normal activity: service start, version, policy received, search started or completed. Useful for establishing a timeline and confirming that something happened at all.
- WARN — something was skipped or degraded but the operation continued, for example a location that could not be reached. Worth reading when results are incomplete.
- ERROR — an operation failed. These are the lines to triage first.
- DEBUG / verbose entries — only present when logging detail has been raised. See Increasing Logging Detail.
An EPS log with no ERROR lines is meaningful in itself. If the most recent log is clean, the endpoint is very likely communicating with the Console and the fault lies elsewhere — in Console-side configuration, tagging, policy assignment, or permissions. In that case, stop reading the EPS log and move to Console-side troubleshooting.
Common EPS Log Errors and Their Meaning
The following entries account for the large majority of endpoint communication failures.
Full remediation steps for each are in "How to Troubleshoot Endpoints That are not Communicating With the Console."
System Error: 12002 — ERROR_WINHTTP_TIMEOUT
The request timed out.
- Confirm the
serverUrlthe endpoint is configured with is reachable from a browser on that machine. - Confirm IIS has the correct HTTP and HTTPS bindings.
- Also see where SOAP is blocked on the LAN — ports 80, 8080 and 443 must be open.
System Error: 12007 — ERROR_WINHTTP_NAME_NOT_RESOLVED
The server name could not be resolved, which is almost always DNS.
- Browse to the
serverUrlfrom the endpoint and use the Test Services Connection link on that page. - Ensure an HTTP binding still exists in IIS even when using HTTPS, and that bindings are not restricted to specific IP addresses.
System Error: 12029 (Windows) or Connection refused (61) (macOS)
The connection to the server failed.
The classic cause is an installer built from a clientsettings.reg downloaded via localhost/services on the Console server — the serverUrl is then baked in as localhost and is unreachable from any other machine.
- Rebuild the installer using a URL that endpoints can actually reach.
- A second known cause is an endpoint proxy redirected to
127.0.0.1:8888; reset it with the commandnetsh winhttp reset proxy.
System Error: 12030 / 12130 — ERROR_WINHTTP_CONNECTION_ERROR
The connection was reset or an incompatible SSL protocol was encountered.
- This is typically a TLS protocol or cipher-suite mismatch between a hardened IIS server and an endpoint OS that has not been updated to match.
System Error: 12175 — ERROR_WINHTTP_SECURE_FAILURE
An SSL certificate problem.
- Usually the certificate is not trusted on the endpoint, or the host name in
serverUrldoes not exactly match the name on the certificate. - Testing over HTTP will confirm whether the fault is specifically in the SSL configuration.
Connection reset by peer (54)
Generally resolved by disabling Require Server Name Indication in the IIS site bindings for the HTTPS site.
ServerUrl not defined
The client was installed without the information it needs to find the Console.
- The installer was built without a valid
clientsettings.reg(Windows) or settings XML (macOS). - Import the correct settings file and restart the endpoint service, or rebuild and redeploy the installer.
Failed to acquire an endpoint ID
Not a standalone fault — it is the consequence of whichever error precedes it.
- It means registration never completed, so the endpoint will not appear in the Console.
- Diagnose the error immediately above it.
Tip: to check which Console URL the endpoint is actually configured to use, read serverUrl from the registry on Windows (HKLM\Software\Identity Finder\Client\Console, or HKLM\Software\Wow6432Node\Identity Finder\Client\Console on 64-bit), from system.com.identityfinder.macedition.xml on macOS, or from /var/lib/identityfindercd/identityfindersettings.xml on Linux 11.4 and later.
Reading Search Logs
Search logs record every location the Agent visited during a search and, where a location could not be processed, the reason it failed.
Typical failure reasons include:
- The user name or password is incorrect
- Access is denied
When reading a search log do the following:
- Confirm the search started — look for the opening
INFOentries before assuming the agent ignored the task. - Scan for repeated permission failures against the same share or path. A cluster of Access is denied entries on one target usually means the service account lacks rights, not that the target is clean.
- Compare the number of locations searched against what you expected. A search that finishes suspiciously quickly with few locations is normally a scope or permissions problem.
- Check the end of the file for the completion entry. A log that simply stops mid-search indicates the agent or machine was interrupted.
Important: Per-location detail is written only if the corresponding logging options are enabled on the endpoint. If the search log is sparse, raise the logging detail and re-run the search before drawing conclusions.
How to Increase Logging Detail
Default logging is deliberately conservative.
When the log does not contain enough information, logging options can be adjusted in the client on the endpoint.
- Open the Spirion client and go to the Configuration ribbon.
- Use the Logging control on the ribbon, or click Settings and select the Logging page in the left-hand list.
- Enable the categories you need — notably search location logging, which is what populates the per-file detail in the Search logs.
- Reproduce the problem, then collect the logs.
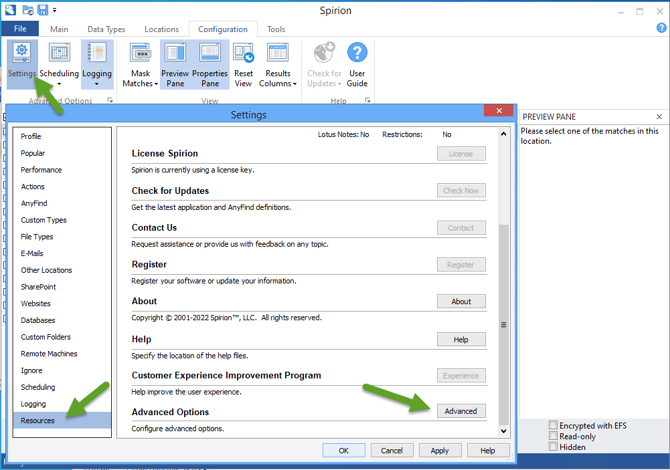 The Configuration ribbon exposes both a Logging control and the Settings dialog. The Logging page in the left-hand list holds the per-category logging options; Resources > Advanced is where Gather Data lives.
Remember to turn verbose logging back off once you have what you need. Elevated logging produces substantially larger files and adds I/O overhead on the endpoint during searches.
Note: Settings applied locally on an endpoint are overwritten the next time the endpoint receives policy from the Console. To make a logging change persist on a managed endpoint, apply it through a System Policy rather than locally.
How to Collect Logs with Gather Data
Rather than copying log folders by hand, use Gather Data. It packages the logs together with the settings files into a single zip, which is the format Spirion Support expects.
Inside the zip, the endpoint service logs are in a folder named EPSLogFile.
From the SDP Console (Agent is communicating)
Perform the following steps in SDP:
- Go to Agents > Agent Management.
- Locate and select the target machine.
- Click the three-dot menu at the right of the agent's row and choose Gather Data.
- Retrieve the result from Reports > Agent Logs.
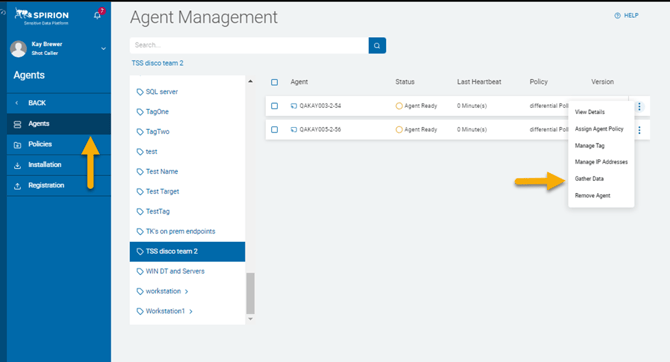 Agent Management → three-dot row menu → Gather Data. The collected package appears under Reports > Agent Logs.
From the endpoint (Agent is not communicating)
If the Agent is not responding to the Console, the Gather Data command cannot be sent to it. Collect the data locally instead.
Perform the following steps from the Spirion Client GUI, launched from the Agent machine.
- Launch the Spirion client and click the Configuration tab.
- The Configuration ribbon opens.
- Click Settings, then select the Resources page.
- Scroll to Advanced Options and click Advanced.
- In the dialog, click Gather Data.
- Choose a location to save the zip file.
- Attach the zip to a new or existing support ticket.
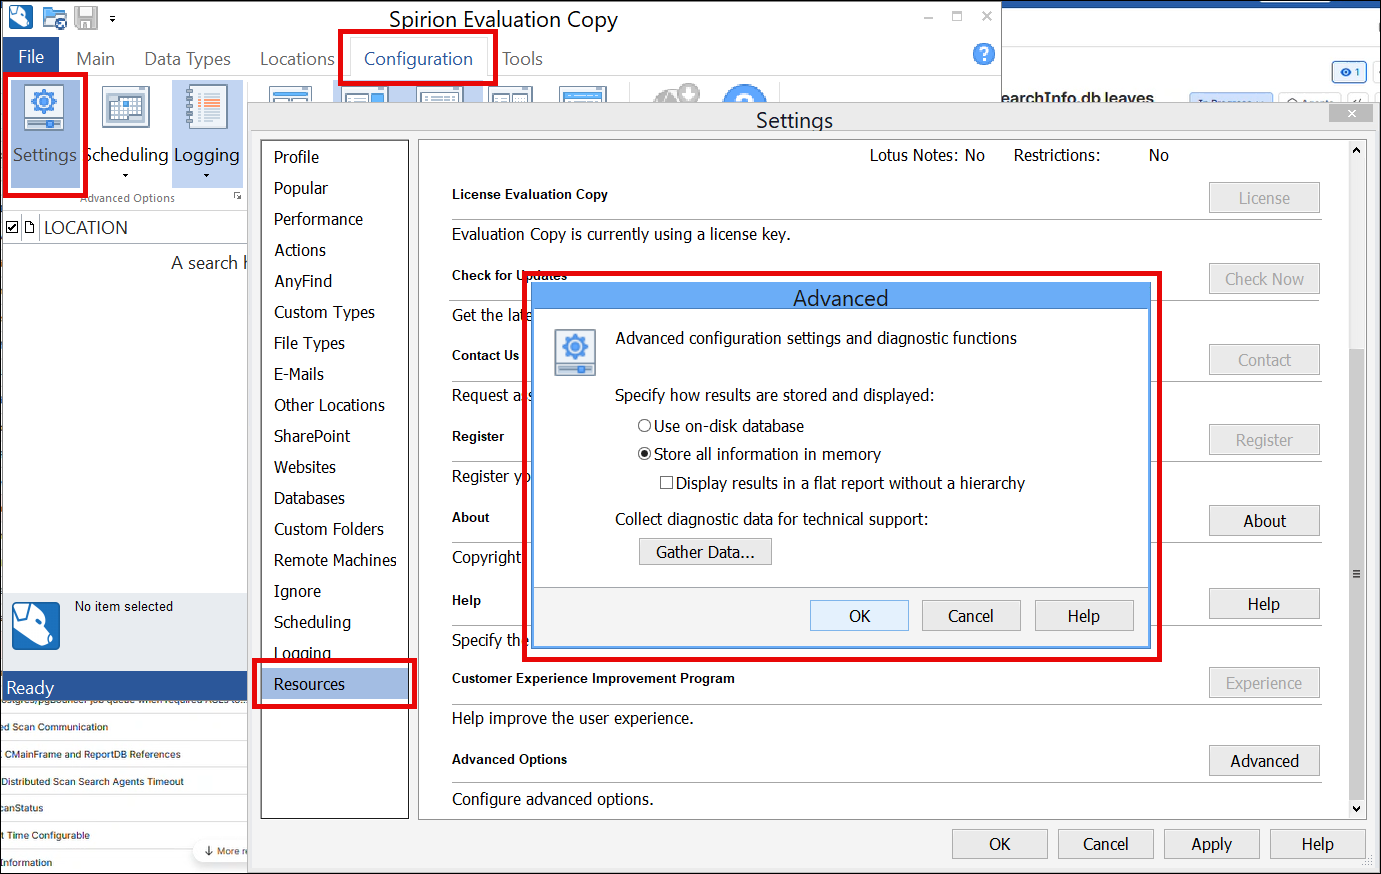
The Advanced dialog, reached from Settings > Resources. Gather Data... sits under “Collect diagnostic data for technical support”.
From the command line (Windows)
Gather Data can also be triggered without the GUI, which is useful for scripted or remote collection:
"C:\Program Files (x86)\Spirion\identityfindercmd.exe" /gatherdata gatherdatapath=C:\path\to\where\you\want\zip\savedReplace the path with the location where the zip should be written.
Quick Triage Checklist
- Pick the right log. Communication problem → EPS. Search problem → SystemSearch.
- Open the newest file. Sort by date modified. A large number of recent files means the service is restarting repeatedly — that is your finding.
- Read the first INFO line. Record the agent version and the service start time.
- Search for
ERROR. Go to the earliest error in the run, not the last one. - Extract the numeric code. Look up the
System Error:value in Common EPS Log Errors above. - Check the Context.
RequestGuidmeans registration never completed;GetClientStatemeans a routine poll failed. - Ignore the repeats. Evenly spaced identical errors are one problem retrying.
- If the log is clean, stop. Move to Console-side troubleshooting — tags, permissions, policy assignment.
- Escalating? Run Gather Data and attach the zip rather than pasting excerpts.