
Spirion Sensitive Data Platform Healthcheck Page
How do I load the page?
The healthcheck dashboard can be loaded by appending the characters '/healthcheck' onto the end of your SDP URL: https://console-web.<client-specific-domain>-spirion.com/healthcheck
Sample healthcheck page
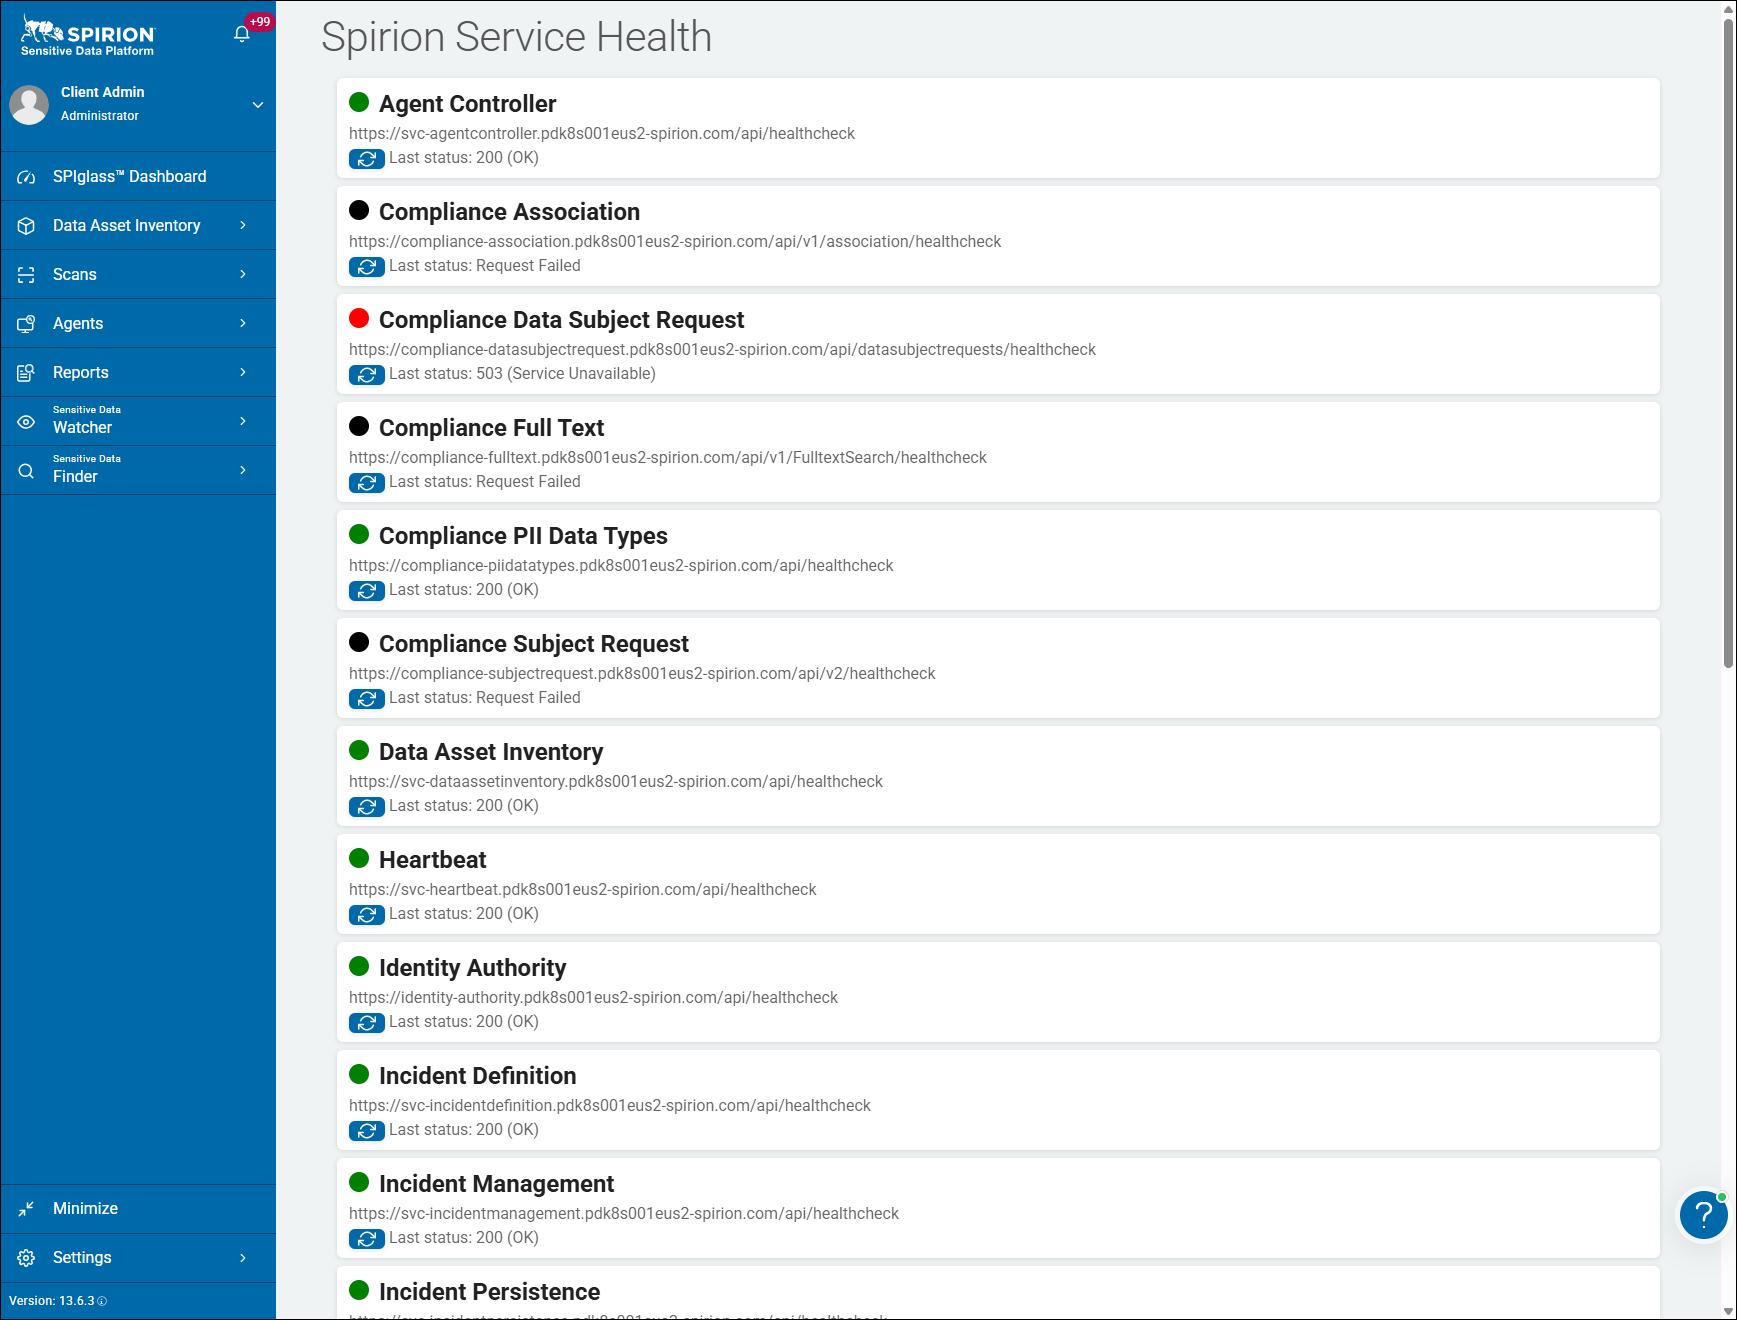
What the Page Displays
- Context & Environment: The page is hosted at
https://console-web.qa-spirion.com/healthcheck. - In this example the user profile in the navigation bar indicates a session logged in as Client Admin / Administrator.
- Microservices Monitored: Each service is displayed as an individual card with a green status indicator, the service name, its direct API endpoint (for example,
https://<service-name>.qa-spirion.com/api/healthcheck),a manual refresh button, and its latest response code). - Each card shows the service health endpoint and the most recent HTTP result, for example:
Last status: 200 (OK)
- Each card shows the service health endpoint and the most recent HTTP result, for example:
Microservices
The microservices displayed across the Spirion Sensitive Data Platform (SDP) healthcheck dashboards are categorized by domain:
1. Core Platform, Identity & Ingress
- Identity Authority (
identity-authority) - Definition: Central authentication, security token, and identity brokering authority.
- Role & Function: Issues, validates, and manages JSON Web Tokens (JWT) for the web console and inter-service authentication across all microservices. It validates organization codes and checks user and role permissions.
- Organization (
svc-org) - Definition: Tenant organization, endpoint configuration, and governance manager.
- Role & Function: Manages tenant organizations, Activity Watcher endpoint configurations, and policy definitions. Validates secure organization codes with Identity Authority.
- Registration (
svc-registration) - Definition: Agent and Activity Watcher enrollment gateway.
- Role & Function: Coordinates the initial registration and pairing handshake for new Cloud Agents and Activity Watchers with the platform in coordination with
svc-org.
- Heartbeat (
svc-heartbeat) - Definition: Endpoint liveness and connectivity ingestion API.
- Role & Function: Continuously collects and tracks incoming heartbeat signals dispatched by active Cloud Agents and Activity Watchers to monitor device operational status.
- Ingress (
svc-ingress) - Definition: High-throughput telemetry and agent result ingestion gateway.
- Role & Function: A Node.js service that ingests agent operational statuses and raw discovery findings from edge agents, dispatching them to Kafka topics (
agentstatus_00002,searchresult_00002,searchresultdiscovery_00002).
- Infrastructure (
svc-infrastructure) - Definition: Cluster database and resource provisioning coordinator.
- Role & Function: A Python-based automation and orchestration service responsible for cluster infrastructure management and provisioning tenant databases.
- Utility (
svc-utility) - Definition: Cross-service notification and lookup bridge.
- Role & Function: Bridges communication between legacy agent workflows (via
svc-sdmtranslator) and the broader platform, handling user queries, in-app notifications, and email alerts.
2. Incident Management & Remediation
- Incident Definition (
svc-incidentdefinition) - Definition: Policy violation criteria and incident rule store.
- Role & Function: Defines what scan findings constitute an incident, tracks severity rules, and verifies playbook and custom notification criteria with Search Controller and Remediation.
- Incident Management (
svc-incidentmanagement) - Definition: Active incident lifecycle coordinator.
- Role & Function: Tracks incident status transitions, assigns incidents to users or groups, validates permissions with Identity Authority, and triggers associated remediation actions.
- Incident Persistence (
svc-incidentpersistence) - Definition: Incident database persistence engine.
- Role & Function: Dedicated persistence service responsible for writing, updating, and querying incident history, state transitions, and audit trails in underlying database storage.
- Remediation (
svc-remediation) - Definition: Playbook remediation action manager.
- Role & Function: Manages and executes playbook remediation scripts (e.g., quarantine, redact, shred, apply classification tags) on endpoints by script ID, interacting with Identity Authority and Search Controller.
3. Agent Control, Search & Pipeline Processing
- Agent Controller (
svc-agentcontroller) - Definition: CloudAgent and SuperScan endpoint orchestrator.
- Role & Function: Tracks client agent states (
GetClientState), processes "Scan Complete" events, dynamically generates endpoint scan and classification policies, and issues policy attachments to connected endpoints.
- Search Controller (
svc-searchcontroller) - Definition: Search orchestration, policy management, and console proxy service.
- Role & Function: The central platform coordination hub managing classification definitions, agent configurations, and user/role lookups; acts as a proxy between the console UI and downstream persistence layers.
- Search Persistence (
svc-searchpersistence) - Definition: Search result ingestion and pipeline storage engine.
- Role & Function: Consumes incoming search findings from Kafka (
searchresults_00002), executes import processing, triggers auto-remediation workflows, and forwards findings tosearchhistory_00002and notification topics.
- Data Watcher (
svc-datawatcher) - Definition: Real-time data asset modification monitor.
- Role & Function: Processes activity watcher events and interacts with the task scheduler (
TasksScheduler) to generate targeted scan policies whenever files are modified.
- SDM Translator (
svc-sdmtranslator) - Definition: Legacy Sensitive Data Manager (SDM) protocol bridge.
- Role & Function: Serves as the compatibility layer for legacy SDM Agents, fetching policy definitions via Search Controller and proxying agent notifications to Utility.
4. Compliance & Data Subject Request (DSR) Module
- Compliance Subject Request (
compliance-subjectrequest/svc-subjectrequest) - Endpoint:
/api/v2/healthcheck - Definition: Primary Compliance and Privacy API gateway.
- Role & Function: Connects directly to PostgreSQL to manage the storage and retrieval of Data Subject Access Requests (DSAR) and serves compliance records to the console UI.
- Endpoint:
- Compliance Association (
compliance-association/svc-association) - Endpoint:
/api/v1/association/healthcheck - Definition: Identity and data asset relationship graph engine.
- Role & Function: Controls read access to Dgraph via direct gRPC connections to Dgraph Alpha nodes, mapping data subjects to discovered sensitive assets and PII locations.
- Endpoint:
- Compliance Full Text (
compliance-fulltext/svc-fulltext) - Endpoint:
/api/v1/FulltextSearch/healthcheck - Definition: Compliance text search and indexing engine.
- Role & Function: Connects to Apache Solr (
compliance_core) to query indexed text and serve full-text search results to the compliance UI and subject search workflows.
- Endpoint:
- Compliance PII Data Types (
compliance-piidatatypes) - Endpoint:
/api/piidatatypes/healthcheck - Definition: Compliance classification catalog manager.
- Role & Function: Manages personal data definitions, entity patterns, and regulatory PII classifications used in compliance audits and subject discovery.
- Endpoint:
- Compliance Data Subject Request (
compliance-datasubjectrequest/svc-datasubjectrequest) - Endpoint:
/api/datasubjectrequests/healthcheck - Definition: External/third-party DSR integration API.
- Role & Function: Outward-facing API for third-party privacy portals to submit requests and query subject processing statuses.
- Endpoint:
Value Provided by the Healthcheck Page
- Centralized Status Aggregation: Provides a single-pane-of-glass overview of all backend microservices without requiring users to manually curl individual URLs or run
kubectlcommands. - Granular Dependency Visibility: Because each service exposes its own
/api/healthcheckendpoint, the page verifies not just the frontend web layer (console-web), but also service-to-service communication, database readiness, and middleware responsiveness. - On-Demand Validation: The individual refresh buttons enable testers and operators to verify real-time recovery immediately after restarting a service or applying a hotfix.
- It gives you a fast answer to the question “Are the core SDP backend services reachable and responding?”
- That is useful because SDP is not one monolithic app. The console depends on multiple services. A page can load while a specific backend function is still broken.
- For example:
- If Identity Authority is down, login/authentication may fail.
- If Registration is down, agents may not register correctly.
- If Ingress is down, agent results may not be accepted into the backend pipeline.
- If Remediation is down, remediation actions may fail or not process.
- If Organization is down, tenant/org-related lookups may fail.
- If Incident services are down, Watcher/incident-related features may fail.
Problems the Healthcheck page Solves
The Healthcheck page helps with first-pass triage.
Valid uses:
- Root-Cause Isolation During Outages:
- Confirm whether backend services are up
- Check if a deployment or environment is broadly healthy
- Verify whether a specific service is returning 200 OK
- Quickly distinguish a UI/browser issue from a backend-service outage
- Identify obvious service-level failures before digging into logs
- Cluster/Global vs. Single-Service Failures: If all services report errors or fail to resolve, it immediately points to an ingress, DNS, or TLS certificate failure. If only a single card (for example,
svc-incidentmanagement) fails, triage is instantly narrowed to that specific pod or database dependency. - Shared Dependency Degradation: Patterns of failing services quickly diagnose shared infrastructure issues—such as distinguishing when Redis needs to be bounced vs. when Kafka communication has stalled.
- Elimination of False Bug Reports:
- Support demos, QA testing, and troubleshooting by establishing a baseline.
- Prevents teams from submitting application code bug tickets when UI features fail to load due to an offline or unready backend microservice.
- Deployment Gatekeeping:
- Confirms that all container pods have initialized and passed their liveness and readiness probes following platform upgrades, migrations, or maintenance.
Examples:
- If Agents are not registering and the Registration healthcheck is failing, you know to investigate that service first rather than starting with agent logs.
- If results are not appearing and Ingress is failing, that points toward the result-ingestion edge rather than the scan engine itself.
What problems does the Healthcheck page not solve?
It does not prove the full product workflow is healthy.
A 200 OK healthcheck usually means: “The service is alive enough to answer its health endpoint.”
It does not necessarily prove:
- Scans can complete
- Agents can connect from customer networks
- Result payloads are being imported correctly
- Kafka/search persistence/SQL are fully caught up
- Authentication tokens are valid for all target types
- Playbooks/remediation actions are functionally succeeding
- Search History is behaving correctly
- The service has no internal partial degradation
- Downstream dependencies are all processing normally
So it is a smoke test, not a full end-to-end validation.
Should It Be Checked on a Regular Basis?
Yes, in specific operational and testing workflows:
- Post-Deployment & Upgrade Verification: It serves as the primary gateway check immediately after deploying changes or applying patches to confirm all services report
200 (OK)before traffic is routed. - Automated vs. Manual Checks: While internal orchestrators (Kubernetes liveness/readiness probes) check these endpoints continuously in the background, manual checks are regularly performed for incident triage and environment handoffs.
- Performance-related issues: If users report “the console is slow/broken.” If scan results do not appear or if remediation or incident features are failing.
- Registration Issues: When Spirion Agents are not registering.
For operations, this should ideally be automated through monitoring rather than manually checked all day. But for support purposes, checking it manually at the start of an investigation is useful.
Do You Need Admin Rights to Use It?
- Viewing the Healthcheck:
- The underlying
/healthcheckand/api/healthcheckendpoints are standard operational probe endpoints designed for orchestrators, monitoring tools, and QA smoke testing. - They are read-only and do not require elevated administrative privileges in the application console to view status output.
- The underlying
- Remediation & Actioning Failures:
- Yes. While anyone with environment access can observe a red or
non-200status, investigating the root cause and resolving failures - For example, inspecting container logs, bouncing pods via
kubectl, clearing/bouncing Redis caches, or updating database credentials) requires infrastructure-level and Kubernetes cluster administrator privileges.
- For example, inspecting container logs, bouncing pods via
- Yes. While anyone with environment access can observe a red or
Example Healthcheck Page and Recommended Actions
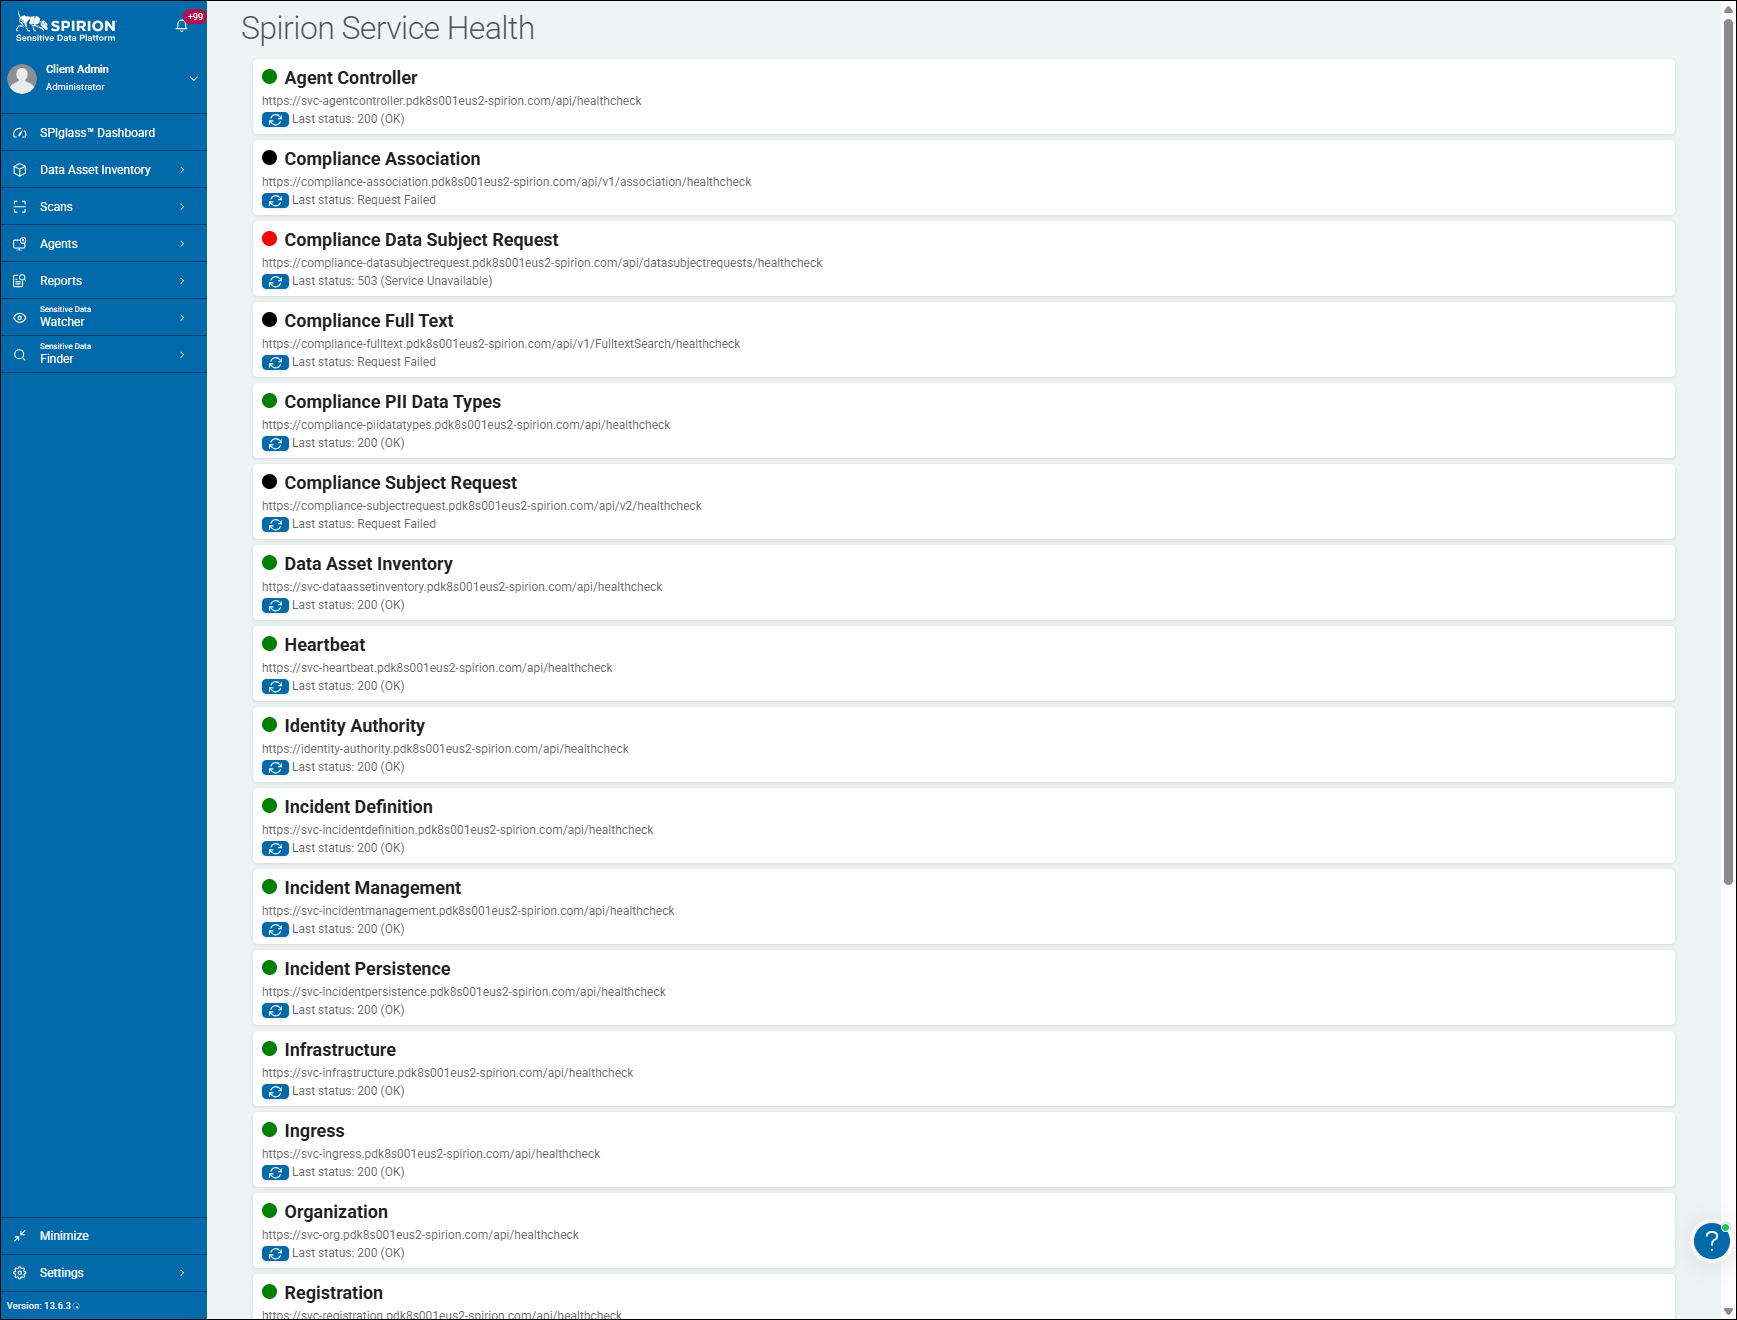
The dashboard in this example, Spirion Service Health, v13.6.3 in environment pdk8s001eus2-spirion.com shows that the core platform microservices (Agent Controller, Heartbeat, Identity Authority, Ingress, Incident Definition/Management/Persistence, Organization, Registration) are all healthy (Green – 200 OK).
The failures are isolated specifically to the Compliance / Data Subject Request (DSR) module:
Microservice | Healthcheck Endpoint | Status in Screenshot | Primary Dependency / Meaning |
|---|---|---|---|
Compliance Association |
| ⬛ Black ( | Controls read access for Dgraph via direct gRPC connection to Dgraph Alpha. |
Compliance Data Subject Request |
| 🔴 Red ( | Outward-facing DSR API. Known in internal documentation to throw 503 or fail when backing services or WIP features are not ready. |
Compliance Full Text |
| ⬛ Black ( | Reads indexed data from Solr ( |
Compliance Subject Request |
| ⬛ Black ( | Primary Compliance API; accesses the PostgreSQL database to serve UI records. |
(Note: Compliance PII Data Types is reporting Green 200 OK, confirming the issue is not a total network partition of the compliance namespace, but rather connectivity to backing datastores or specific container crashes).
Triage & Remediation Workflow
The following triage and remediation steps could be used to solve issues such as those shown in the sample healthcheck page, at the top of this article.
When the healthcheck page shows a red or black microservice, treat it as a service-level triage signal, not as a full diagnosis.
- Green = Service healthcheck returned 200 OK
- Red = Service responded but returned a failing status, e.g. 503 Service Unavailable
- Black = Request failed, meaning the console/browser could not successfully reach or complete the healthcheck request
1. Quick Refresh & Pod State Verification
- Click the Refresh button (circular arrow) next to each failing card to rule out transient HTTP probe timeouts.
- Source your Kubernetes environment credentials and inspect the pods in the compliance namespace:
kubectl get pods -l 'app in (compliance-association, compliance-datasubjectrequest, compliance-fulltext, compliance-subjectrequest)' - Check for pods in
CrashLoopBackOff,Error,Pending, orImagePullBackOff. If any pod is notRunning:kubectl describe pod <pod-name>
kubectl logs <pod-name> --tail=100
2. Check Backing Datastores and Infrastructure
Because these services rely on distinct data engines, verify their backing services:
A. Dgraph Cluster (for Compliance Association)
- What it affects:
compliance-associationconnects directly to Dgraph Alpha via gRPC. - Checks:
- Navigate to the Dgraph Ratel dashboard endpoint (for example,
https://compliance-dgraph.<env>-spirion.com/). - Enter the Alpha endpoint (for example,
https://compliance-dgraph-alpha.</env>-spirion.com/). - Ensure three green dots appear under the Alpha endpoint text box, indicating that the Alpha cluster is healthy and reachable.
- Check
svc-upsertdgraphlogs to verify the schema is loaded:
- Navigate to the Dgraph Ratel dashboard endpoint (for example,
kubectl logs -l app=svc-upsertdgraph --tail=100 | grep "Schema found"
# Should report: update-consumer INFO ≫ Schema found = True
B. Solr Engine (for Compliance Full Text)
- What it affects:
compliance-fulltextqueries Solr to feed text search to the UI. - Checks:
- Access the internal Solr service endpoint (internal cluster port-forward, no ingress):
kubectl port-forward svc/solr 8983:8983- Open
http://localhost:8983in your browser. Under Core Admin, verify thatcompliance_coreis present and document metrics are populating. - If Solr is down or the core failed to load, inspect Solr pod logs and restart the Solr deployment if necessary.
C. PostgreSQL Database (for Compliance Subject Request)
- What it affects:
compliance-subjectrequestqueries Postgres to retrieve and store subject records. - Checks:
- Verify Postgres pod health and connectivity:
kubectl get pods -l app=postgres
kubectl logs -l app=postgres --tail=100
- Confirm database user permissions or run a connection test to ensure credentials have not lapsed or locked following database upgrade jobs.
D. Svc-DataSubjectRequest (503 Service Unavailable)
- Context: Internal documentation notes that
svc-datasubjectrequestis an outward-facing third-party API that may be non-functional (WIP) or dependent on all other compliance APIs being healthy first. - Inspect its logs for unhandled upstream timeouts or missing configuration secrets:
kubectl logs -l app=compliance-datasubjectrequest --tail=150
3. Restarting Services
If the backing datastores (Dgraph, Solr, Postgres) are healthy but the microservices remain in an error state (often due to stale connection pools or initial boot ordering):
# Gracefully roll out restarts for the failing compliance microservices
kubectl rollout restart deployment compliance-association
kubectl rollout restart deployment compliance-fulltext
kubectl rollout restart deployment compliance-subjectrequest
kubectl rollout restart deployment compliance-datasubjectrequest
Once the pods reach 1/1 Running, refresh the healthcheck dashboard.
Practical takeaway
The healthcheck page is valuable as a quick backend service smoke test. It helps answer, “Are the core services alive and reachable?”
It is worth checking regularly during QA/support workflows and after changes, but a green page does not prove scans, results, remediation, or agent communication are fully healthy end-to-end.